Reference no: EM133147410
Question 1. Convert this influence diagram into a decision tree. All Decisions and Risks are binary (have only two states, e.g., black/white, up/down, hot/cold)
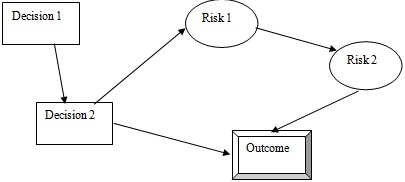
a) Of the five connecting arrows, how many could show relevance not merely timing? Why?
b) Can there be more than one correct representation of the decision tree corresponding to this influence diagram? If no, why not. If yes, about how many different "correct" trees are there?
c) What does the arrow between Risk 1 and Risk 2 signify?
d) Is Outcome a function of Risk 1, Risk 2 and Decision 2 or just Risk 2 and Decision 2? Why
Question 2 A project's uncertainty was evaluated using a Monte Carlo risk analysis model. The following results were obtained:
Original estimated project cost = $14,500,000
Evaluated (mean) project cost = $23,800,000
Evaluated maximum cost = $33,000,000
Evaluated minimum cost = $12,800,000
Evaluated standard deviation = $3,300,000
The shape of the distribution created from the Monte Carlo is approximately Normal (Gausian).
When the project was completed the True (actual) final project cost = $27,300,000
Was the uncertainty/risk evaluation good (accurate, useful) for the project team? Note your assumptions and provide numerical justification for your answer to this question.
Question 3. A highway construction contractor has developed a base estimate for a project of $18,500,000. Additionally, they completed a qualitative risk analysis in preparation for their bid based on the following information.
Risk Register
|
Risk Description
|
Probability of Occurrence
|
Cost Impact
|
|
Delay due to extreme weather
|
Medium
|
Very Low
|
|
Delay in obtaining permit
|
Low
|
Low
|
|
Subcontractor default
|
Very Low
|
High
|
|
Failure to pass quality control test
|
Medium
|
Low
|
|
Delay in material delivery
|
High
|
Very Low
|
Cost Impact Probability of Occurrence
|
Description
|
% of Base Cost
|
|
Description
|
Probability
|
|
Very Low
|
0-1%
|
|
Very Low
|
0-5%
|
|
Low
|
1-2%
|
|
Low
|
5-10%
|
|
Medium
|
2-5%
|
|
Medium
|
10-30%
|
|
High
|
5-10%
|
|
High
|
30-70%
|
|
Very High
|
10-20%
|
|
Very High
|
70-100%
|
a. Given only the information above, rank the risks in order of importance.
b. Given only the information above and using the mean value method, what contingency should the contractor include in its bid?
c. Please provide three specific reasons why this analysis of contingency might be insufficient or incorrect.