Reference no: EM132892982
MGMT6019 Supply Chain Planning and Design - Curtin University
Objective
This assessment relates to the unit learning outcomes 1, 2, and 3 in the unit outline as listed below:
• Analyse and communicate an understanding of supply chain planning and design
• Create solutions to problems using analytical skills in addressing the supply chain.
• Evaluate performance in supply chains from the application of systematic process-driven tools.
Guidelines
Please exclude the descriptions of questions and only include the answers and corresponding figures, formulas, and explanations for each part of the questions.
The answer document should be submitted in MS. Word format to Turnitin via the link provided in the Blackboard only by a person on behalf of the whole group.
• Label all tables and figures correctly. Assignment must be typed as much as possible.
• Assignment must include a cover sheet with student's full details. A group can have up to maximum 3 students. Interpretation and insights should follow the relevant information. All results must be verified by complete calculations. Single answers are generally not acceptable.
• Please solve all the questions only with Excel/Excel Solver and do not use any other software.
The lecturer may request an Excel copy to check on formulas used so be prepared for this and keep a back-up copy.
Questions
Question 1, Distribution Strategies:
XYZ Industries operates five (5) factories. They distribute their products through five (5) distribution centers (DCs) that serve a specific market. ABC has utilized a cross-docking strategy to decrease the number of direct shipments between factories and regional DCs and improve the load factor of shipments. XYZ has now decided to open an additional cross-docking facility due to their existing cross-docking facility's success. The transportation costs between facilities and capacities of each factory and also weekly demand required for each DC are represented in Figure 1 :

Figure 1: Data for Question 1
XYZ aims to minimize the whole distribution costs. Please answer the following questions:
(a) Develop an optimization model that can produce the optimal distribution plan. You should define your decision variables clearly, write out the constraints that must be satisfied and write the objective function with the explanation.
(b) How many units of products are weekly transshipped to DCs through cross-docks 1 and 2?
(c) Which DC's will be served by each cross-dock center?
(d) What is the minimum total distribution cost?
(e) Please find the new optimal value of total cost for each of the cases below separately.
(i) The maximum weekly flow of 400 units is allowed through each of the cross-docking facilities.
(ii) Cross-dock 2 is shut down.
(iii) The capacity of Factory 5 is reduced to 150 units.
Question 2, Network Design:
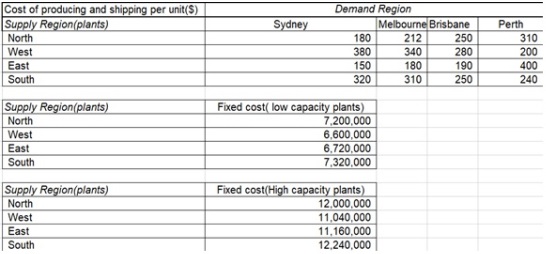
XYZ is an Australian manufacturer of electronic devices that has seen its demand grow significantly. The company predicts the nationwide demand for the next year to be 120,000 units in Sydney, 110,000 units in Melbourne, 100,000 units in Brisbane, and 80,000 units in Perth. The supply chain manager at XYZ wants to design the supply chain network and has selected four potential sites-North, West, East, and South of Australia for the manufacturing plants. The plants can produce either 240,000 (low capacity) or 480,000(high capacity) units. The annual fixed costs of plants at the four locations, along with the cost of producing and shipping to each of the four markets, are shown below in Figure 2.

Figure 2: Data for Question 2
(a) Develop an optimization model that can produce the optimal network design. You should define your decision variables clearly, write out the constraints that must be satisfied and write the objective function with the explanation.
(b) Where should XYZ build its factories, and how large should they be? What is the minimum total cost?
(c) If the supply chain manager needs to take into account the new constraint that each plant should be in the North site, what will be the new total cost?
(d) Consider part b again and relax the constraint in part c. Suppose the SCM manager wants to centralize all the manufacturing plants in the West of Australia and satisfy the whole market demands in different regions from there. How much will be the total cost? Do you recommend this policy?
Question 3, Forecasting:
ABC is a manufacturer of consumer products based in Singapore. Alice had a lot on her mind when she was attending the conference room at ABC corporation. Her line manager had informed her that she would be assigned to a team to improve supply chain performance. The reason was that ABC had been unable to satisfy the demand of its customers over the previous several years. The team's first responsibility was to establish a predictive analytics and forecasting module using historical data from ABC and its customers. This prediction will be used as the basis for improving the firm's performance, as managers could use this more accurate forecast for their sales and operations planning.
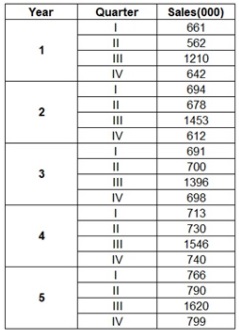
Over the past five years, the consumer products business has grown gradually. Figure 3 represents historical quarterly Sales in 1000 units for the past five years. Alice wants to select the best forecasting method to predict sales for the next four quarters in the coming year 6.

Figure 3: Data for Question 3
(a) Plot the historical number of sales. What do you notice?
(b) Forecast quarterly sales for year 6 using a 4-period moving average. Evaluate the MAD and MAPE.
(c) Forecast quarterly sales for year 6 using simple exponential smoothing. Evaluate the MAD and MAPE. Use an alpha value of 0.25.
(d) Forecast quarterly sales for year 6 using the Holt method. Evaluate the MAD and MAPE. Use an alpha and beta value of 0.1.
(e) Forecast quarterly sales for year 6 using the Winter method. Evaluate the MAD and MAPE. Use an alpha, beta, and gamma value of 0.1.
(f) What is the best method that you recommend, Alice?
Question 4, Production Planning( Aggregate Planning):
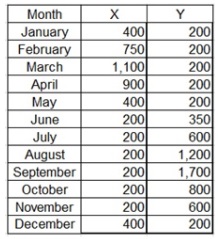
Alex left the meeting with his strategic planning team, wondering whether it made sense to replace the individual plants for X and Y products with a centralized plant that could assemble and produce both products. Forecasted demand for each product X and Y is highly seasonal, as shown in Figure 4:

Figure 4: Data for Question 4
As can be seen, demand for X picks in March, whereas the highest need for Y is in September. Each plant is labor-intensive, and the capacity of each plant is only based on the number of workers available. Each machine for producing X or Y needs 120 labor hours for assembly. Each plant operates for 20 days each month and 8 hours per day. Assembly workers are paid $25/hour during the regular time working hours. They can be asked to work more to a maximum of 22 hours per month as overtime. Overtime is paid at the rate of $38/hour. Given the highly seasonal demand for X and Y, some workers will be laid off during the low season and rehired for the pick demand periods. Each layoff cost $5,200, and each rehiring cost $3,500. Each plant follows a push strategy with generally built inventory in preparation for the peak demand. It cost $380 to carry a machine in stock from one month to the next. If a stock-out happens for the customer's order, it can be postponed to the later months. But, it costs $2300 per order for each month. The material cost for each machine is $22,000.
The plant for product X ended in December last year with 252 workers and 300 units in inventory. The plant for product Y ended in December last year with 130 workers and 80 units in stock. The production plan at each plant attempts to meet the forecasted demand at the minimized total cost while making sure that each plant ended December of the following year with the same labor and inventory as the previous December last year.
Standard assembly procedures for the two products X and Y would allow the same labor for the two products in the centralized plant. This had the potential to decrease the number of employees. Moreover, Alex thing that using a centralized plant instead of the current individual's plants for producing X and Y, improves employee morale. Alex asked the team to develop a production planning model for individual plants that they produce X and Y products and also the single plant in which both products will be produced.
(a) Develop an optimization model that can produce the optimal production plan. You should define your decision variables clearly, write out the constraints that must be satisfied and write the objective function with the explanation.
(b) Solve the production plan model for product X.
(c) Solve the production plan model for product Y.
(d) Solve the production plan model for the single plant that produces X and Y together.
(e) Compare the three production plans and write your managerial insights. You can also use charts and figures in your answers.
Question 5, Multi-Period inventory models:
You are supposed to work as a consultant to review and improve XYZ's inventory management system. XYZ is a clothing retailer that buys and sells both Men's and Women's suits. A men's suit costs $80 to be purchased from its supplier and sold for $180. Its daily demand has a normal distribution with an average of 100 and a standard deviation of 85. The inventory holding cost for a men's suit is $30 a year. A women's suit costs $110 to be purchased from the seller and is sold for $230 to the end consumer. Its daily demand is normally distributed with an average of 70 and a standard deviation of 55. The inventory holding cost for a women's suit is $40 a year.
XYZ operates 365 days a year. Demand during stock out is lost, and it is not backlogged. It currently adopts a periodic review policy(P policy) for inventory management. It reviews its inventory every 20 days. Employees must work overtime when inspecting the inventory. Therefore, XYZ incurs a cost of $1200 every time it checks its inventory, of which 55% is allocated to counting men's suits and 45% to counting women's suits. After reviewing the inventory, XYZ orders suits from its suppliers. The lead time is four days for the men's suit supplier to get the order ready, whereas the women's suit supplier takes six days to get the order ready. XYZ uses its own truck to pick up the order overnight. A trip to the men's suit supplier costs $2000, whereas a trip to the women's suit supplier costs $2200. If the trips to the men's and women's suit suppliers are combined, the cost is $4000. Currently, XYZ waits for six days after placing its order and then sends the truck to both suppliers to pick up the orders. XYZ's manager wants to have a customer service level(CLS) of 0.95.
(a) General Question: What are the differences between P and Q policy systems?
(b) With the current inventory management system, how much safety inventory should XYZ carry?
(c) Should XYZ change the frequency of its periodic review? Should it always review and pick up men's and women's suits simultaneously?
(d) XYZ is considering the use of an inventory monitoring system to provide real-time inventory counts. After this system is implemented, a continuous review policy( Q policy) will be adopted, and men's and women's suits will be picked up separately. The system costs $520,000 to install and $6,000 per year to maintain. It is predicted that it can last for 20 years. Should XYZ use the inventory monitoring system?
Question 6, Single Period inventory models:
XYZ is an Australian company that designs and sells swimsuits in different cities across the country. The designs of the swimsuits are improved each year. In June, the purchasing, design, and sales departments have a meeting to discuss the product portfolio for the improving, including design, functionality, and price. The new designs are finalized in September, and the purchasing department starts contacting domestic or international suppliers.
Production usually starts in early October and continues until April or May of the next following year. In December, the start of Summer in Australia, retailers begin to place their orders to XYZ. The season stretches from December to May. During the season, retailers place new orders to XYZ, who supplies the retailers from a centralized warehouse in Perth. Sales peak in early January. By approaching the end of the summer in February, sales decrease significantly. When the season ends in May, XYZ markdowns any remaining inventory to the buyers by offering all models at only 30% of the original selling price.
XYZ has negotiated with a supplier for the upcoming year to have SKU# 001211 produced and delivered to XYZ at $200 per unit. SKU# 001211 is sold to retailers at $275.
Suppose total demand for SKU# 001211 for the next selling season is estimated to follow a Normal distribution with an average of 3000 and a standard deviation of 500.
(a) How many SKU# 001211 should XYZ produce to maximize expected profit? How much is the maxi- mum expected profit? Please round to the closest integer.
Last year, SKU# 001211 turned out to be extremely popular and sold out quickly. Since XYZ makes a good margin on the product, management has decided they do not want the same situation again. "We want to have the probability for out-of-stock during the season to be only 4% on this SKU", said the sales manager recently.
(b) How many SKU# 001211 should XYZ produce to ensure that the stock-out probability is precisely 4% during the selling season? You can consider the same demand distribution as in Part a. Please round to the closest integer.
(c) Consider the policy from Part b. With your suggested production quantity in part b, how many units of SKU# 001211 can XYX expect to be under-stocked during the regular selling season? Please answer with two decimals.
(d) Consider the policy from Part b. What is the expected profit from SKU# 001211? Please round to the closest integer dollars.
The policy suggested by the sales manager of having only 4% stock-outs results in a lower profit than the optimal policy calculated in Part a. The sales manager argues the expected profit implied by the optimal policy is biased because it has not taken into account the out-of-stock penalty. Suppose there is the penalty for out-of-stock which is represented by B. Now, reconsider further that the policy suggested in Part b is the policy that maximizes expected contribution when this penalty is taken into account.
(e) What is the penalty cost, B? Please round to the closest integer dollars. Answer without the dollar symbol.
Attachment:- Supply Chain Planning and Design.rar