Reference no: EM131818238
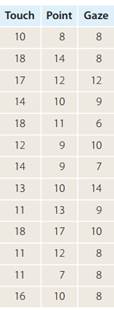
Researchers at the Max Planck Institute for Evolutionary Anthropology in Germany experimented on goats' ability to follow certain social cues, with results published in the online journal Animal Behavior in January 2005. "We tested goats' ability to use gaze and other communicative cues [touching, pointing] given by a human in a so-called object choice situation. An experimenter hid food out of sight of the subject under one of two cups. After baiting the cup the experimenter indicated the location of the food to the subject by using different cues."18 This table shows scores for 13 goats when given the various cues, where the maximum possible score each time was 18, and the typical score for random guessing would be 9.
a. Use software to produce fitted line plots for regressing touch scores on point scores and touch scores on gaze scores. Which of the two plots shows tighter cluster about the regression line?
b. Report the value of s (typical prediction error size) for regression of touch score on point score.
c. Use software to produce a 95% prediction interval for touch score when a goat's point score equals 11 (the approximate mean point score value).
d. In some circumstances, the prediction interval's margin of error is close to 2s, so the interval width is approximately 4s. Explain why in this situation the interval is substantially wider than 4s.
e. Report the value of s (typical prediction error size) for regression of touch score on gaze score.
f. Use software to produce a 95% prediction interval for touch score when a goat's gaze score equals 9 (the approximate mean gaze score value).
g. Report the width of your prediction interval in part (f) and verify that it is wider than 4s.
h. Report correlations for the regression of touch score on point score and for the regression of touch score on gaze score; is the absolute value of the correlation closer to 1 for the larger or for the smaller value of typical prediction size s? Explain why this is the case in terms of how tightly clustered or loosely scattered the scatterplot points are.
i. Both sample sizes are the same, but one of the P-values for testing for a relationship between touch score and the explanatory variable (point score or gaze score) is much smaller. Does it correspond to the regression with the absolute value of the correlation r closer to 0 or to 1?
j. If you wanted to predict touch score for another goat, would it be more helpful to know the goat's point score or gaze score?