Reference no: EM132402983
MATH 210 - Elementary Statistics Assignment
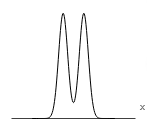
Q1. Determine whether the following graph can represent a normal density function.
Could the graph represent a normal density? function?
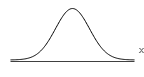
Q2. Determine whether the following graph can represent a normal density function.
Could the graph represent a normal density? function?
Q3. The graph to the right is the uniform probability density function for a friend who is x minutes late.
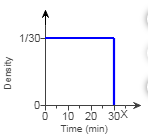
?(a) Find the probability that the friend is between 10 and 25 minutes late.
?(b) It is 10 A.M. There is a 50?% probability the friend will arrive within how many? minutes?
Q4. A study was conducted that resulted in the following relative frequency histogram. Determine whether or not the histogram indicates that a normal distribution could be used as a model for the variable.
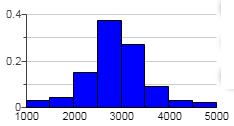
Choose the correct answer below.
A. The histogram is bell dash shaped comma so a normal distribution could be used as a model for the variable.
B. The histogram is not? bell-shaped, so a normal distribution could be used as a model for the variable.
C. The histogram is? bell-shaped, so a normal distribution could not be used as a model for the variable.
D. The histogram is not bell dash shaped comma so a normal distribution could not be used as a model for the variable.
Q5. One graph in the figure represents a normal distribution with mean μ = 11 and standard deviation σ = 2. The other graph represents a normal distribution with mean μ = 16 and standard deviation σ = 2. Determine which graph is which and explain how you know.
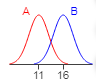
Choose the correct answer below.
A. Graph A has a mean of μ = 16 and graph B has a mean of μ = 11 because a larger mean shifts the graph to the right.
B. Graph A has a mean of μ = 16 and graph B has a mean of μ =11 because a larger mean shifts the graph to the left.
C. Graph A has a mean of μ = 11 and graph B has a mean of μ = 16 because a larger mean shifts the graph to the right.
D. Graph A has a mean of μ = 11 and graph B has a mean of μ = 16 because a larger mean shifts the graph to the left.
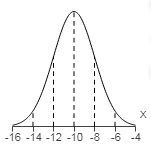
Q6. The graph of a normal curve is given on the right. Use the graph to identify the values of μ and σ.
Q7. Suppose the monthly charges for cell phone plans are normally distributed with mean μ = $65 and standard deviation σ = ?$20.
?(a) Draw a normal curve with the parameters labeled.
?(b) Shade the region that represents the proportion of plans that charge less than ?$45.
?(c) Suppose the area under the normal curve to the left of X = ?$45 is 0.1587. Provide an interpretation of this result.
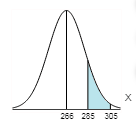
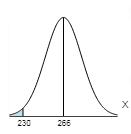
Q8. Suppose the lengths of human pregnancies are normally distributed with μ = 266 days and σ = 16 days. Complete parts ?(a) and? (b) below.
(a) The figure represents the normal curve with μ = 266 days and σ = 16 days. The area to the left of Upper X = 230 is 0.0122. Provide two interpretations of this area.
(b) The figure represents the normal curve with μ = 266 days and σ = 16 days. The area between x = 285 and x = 305 is 0.1101. Provide two interpretations of this area.