Reference no: EM132391972
MATH 210 – Elementary Statistics
Chapter 5 – Probability
1. Rolling a fair die….A win is rolling a 1 or 6 and anything else is a loss.
a. Complete the tree diagram with all of the possible outcomes for two rolls and compute the probability of each. Label a win with W and a loss with L. Make sure to include probabilities in each bubble and at the end.
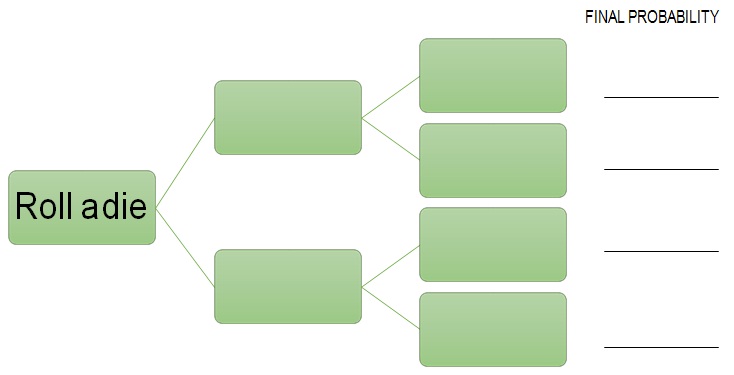
b. What is the probability of having two W’s?
c. What is the probability of having EXACTLY one W?
d. What is the probability of having AT LEAST ONE W?
e. What is the probability of getting a W on the second roll given you get a W on the first roll?
2. In a probability model, the sum of the probabilities of all outcomes must equal, and the probability of a single event must fall between _ and .
3. A certain disease only affects men 20 years of age or older. The chart shows the probability that a man with the disease falls in the given age group. What is the probability that a randomly selected man with the disease is not between the ages of 55 and 64?
|
Age Group
|
Probability
|
|
20-24
|
0.004
|
|
25-34
|
0.006
|
|
35-44
|
0.14
|
|
45-54
|
0.29
|
|
55-64
|
0.32
|
|
65-74
|
0.17
|
|
75+
|
0.07
|
4. There are two bags in front of you containing different colored marbles.
|
|
Blue
|
Red
|
Green
|
Total
|
|
Bag 1
|
15
|
25
|
5
|
45
|
|
Bag 2
|
20
|
50
|
20
|
90
|
|
Total
|
35
|
75
|
25
|
135
|
a. Find the probability of selecting a blue marble.
b. Find the probability of selecting a marble from bag 2.
c. Is the choice of a blue marble independent of the bag you use? Justify your answer.
d. Find P(red marble l bag 1).
e. Find P(bag 1 l red marble).
5. A bag contains 10 white, 12 blue, 13 red, 7 yellow, and 8 green wood balls.
a. Scenario 1 - A ball is selected from the bag, its color noted, then replaced. You then draw a second ball, note its color and then replace the ball. What is the probability of selecting one white ball and one blue ball?
b. Scenario 2 – A ball is selected from the bag and kept. You then draw a second ball and keep it also. What is the probability of selecting one white ball and one blue ball?
Chapter 6 – Discrete Probability Distributions
6. Consider the following probability distribution. Find the probability that x equals 5.
|
x
|
2
|
5
|
6
|
8
|
|
P(x)
|
0.16
|
?
|
0.3
|
0.21
|
1. A lab orders a shipment of 100 rats a week, 52 weeks a year, from a rat supplier for experiments that the lab conducts. Prices for each weekly shipment of rats follow the distribution below:
|
Price
|
$10.00
|
$12.50
|
$15.00
|
|
Probability
|
0.2
|
0.3
|
0.5
|
a. What is the mean cost of the rats each week? What does this value represent?
b. How much should the lab budget for next year’s rat orders assuming the distribution does not change?
7. You draw a marble 350 times from a bag with three colors of marbles. The random variable represents the color of marble that is drawn. Decide whether the experiment is a binomial experiment. If it is not, explain why.
8. The random variable x represents the number of computers that families have along with the corresponding probabilities. Find the mean and standard deviation for the random variable x.
|
x
|
P(x)
|
|
0
|
0.49
|
|
1
|
0.05
|
|
2
|
0.32
|
|
3
|
0.07
|
|
4
|
0.07
|
9. A recent survey found that 69% of all adults over 50 wear sunglasses for driving.
a. In a random sample of 10 adults over 50, what is the probability that at least six wear sunglasses?
b. In a random sample of 20 adults over 50, what is the mean and standard deviation of those that wear sunglasses?
Chapter 7 – The Normal Probability Distribution
10. The analytic scores on a standardized aptitude test are known to be normally distributed with mean µ = 610 and standard deviation σ = 115.
Draw a normal curve with the parameters labeled. Then shade the region that represents the proportion of the test takers who scored less than 725.
11. Determine the area under the standard normal curve that lies between z = 0.3 and z = 1.4.
12. Assume that the random variable X is normally distributed, with µ = 60 and standard deviation σ = 16. Compute the probability P(X < 80).
13. The board of examiners that administers the real estate broker’s examination in a certain state found that the mean score on the test was 426 and the standard deviation was 72. If the board wants to set the passing score so that only 80% of all applicants pass, what is the passing score? Assume that the scores are normally distributed.
14. Multiple Choice - If sample data are taken from a population that is normally distributed, a normal probability plot of the observed data values versus the expected z scores will
a. Have a correlation coefficient near 0.
b. Look exponential in nature.
c. Be approximately linear.
d. Have no discernable pattern.
15. A local concert center reports that it has been experiencing a 15% rate of no-shows on advanced reservations. Among 150 advanced reservations, find the probability that there will be fewer than 20 no-shows. Round the standard deviation to three decimal places to work the problem.