Reference no: EM132475393
MAT120 - College Algebra - Post University
Assignment
Part 2.1
Find the indicated function values.
f(x) = 3x2 + 4x - 2
a. f(0)
b. f(3)
c. f(-5)
d. f(b)
e. f(5a)
B. Part 2.2
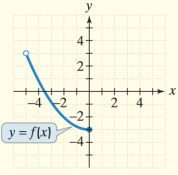
Use the graph of the function to identify its domain and its range using function notation.
C. Part 2.3
Find the domain of each function
g (x) = 1/(x + 5)
D. Part 2.4
Find the slope of the line passing through each pair of points or state that the slope is undefined. Then indicate whether the line through the points rises, falls, is horizontal, or is vertical.
(2, -1) and (-6,3)
E. Part 2.5
Describe how to write the equation of a line if its slope and a point along the line are known.
F. Part 2.1
Find the indicated function values.
f(x) = (3x -1)/(x-5)
f. f(0)
g. f(3)
h. f(-3)
i. f(10)
j. f(a + h)
G. Part 2.2
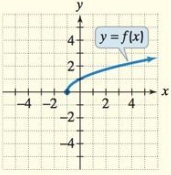
Use the graph of the function to identify its domain and its range.
H. Part 2.3
Find (f + g)(x) and (f + g)(5).
f(x) = 4x2 - x - 3, g (x) = x + 1
I. Part 2.4
3x + y = 2
a. Rewrite the given equation in slope-intercept form by solving for y.
b. Give the slope and y-intercept.
J. Part 2.5
Describe how to write the equation of a line if two points along the line are known.
K. Part 2.1
Find the indicated function values.
|
x
|
h(x)
|
|
-2
|
-2
|
|
-1
|
-1
|
|
0
|
0
|
|
1
|
-1
|
|
2
|
-2
|
a. h (-2)
b. h (1)
c. For what values of x is h(x) = -1?
L. Part 2.2
Use the graph of f to determine each of the following. Where applicable, use interval notation.
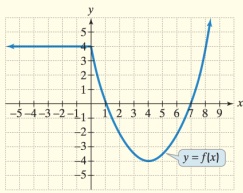
a. The domain of f
b. The range of f
c. f(-3)
d. The values of x for which f(x) = -2
e. The points where the graph of f crosses the x-axis
f. The point where the graph of f crosses the y-axis
g. Values of x for which f(x) < 0
h. Is f(-8) positive or negative?
M. Part 2.3
Let f(x) = -4x and g(x) = -3x + 5.
Find: (f + g)(x),(f - g)(x), (fg), and (f/g) (x) .
N. Part 2.4
2x + y = 4
a. Rewrite the given equation in slope-intercept form by solving for y.
b. Give the slope and y-intercept.
O. Part 2.5
If you know a point on a line and you know the equation of a line parallel to this line, explain how to write the line's equation.
P. Part 2.1
What is a relation? Describe what is meant by its domain and its range.
Q. Part 2.2
Use the graph of f to determine each of the following. Where applicable, use interval notation.
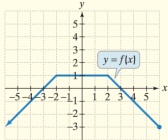
a. The domain of f
b. The range of f
c. f(-4)
d. The values of x for which f(x) = -3
e. The points where the graph of f crosses the x-axis
f. The point where the graph of f crosses the y-axis
g. Values of x for which f(x) > 0
h. Is f(-2) positive or negative?
R. Part 2.3
A company that sells radios has yearly fixed costs of $600,000. It costs the company $45 to produce each radio. Each radio will sell for $65. The company's costs and revenue are modeled by the following functions:
??(x) = 600,000 + 45x this function models the company's costs
??(x) = 65x This function models the company's revenue.
Find and interpret (R - C)(20,000), (R - C)(30,000), and (R - C)(40,000).
S. Part 2.4
Use the figure to make the lists in the following two exercises.
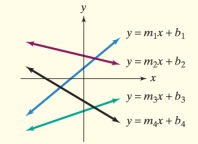
1. List the slopes m1, m2, m3, and m4 in order of decreasing size.
2. List the y-intercepts b1, b2, b3, and b4 in order of decreasing size.
T. Part 2.5
Write the point-slope form of the equation of the line satisfying the following conditions. Then use the point-slope form to write the slope-intercept form of the equation in function notation.
Passing through (-3,2) and (2, -8)
U. Part 2.1
Explain how to determine whether a relation is a function. What is a function?
V. Part 2.2
The wage gap is used to compare the status of women's earnings relative to men's. The wage gap is expressed as a percent and is calculated by dividing the median, or middlemost, annual earnings for women by the median annual earnings for men. The bar graph shows the wage gap for selected years from 1980 through 2010.
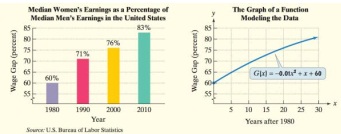
The function G(x) = -0.01x2 + x + 60 models the wage gap, as a percent, x years after 1980. The graph of function G is shown to the right of the actual data. Use this information to solve parts a and b of the exercise.
a. Find and interpret G(10). Identify this information as a point on the graph of the function.
b. Does G(10) overestimate or underestimate the actual data shown by the bar graph? By how much?
W. Part 2.3
If a function is defined by an equation, explain how to find its domain.
X. Part 2.4
The linear function f(x) = -0.28x + 1.7 models the percentage of U.S. taxpayers who were audited by the IRS, f(x), x years after 1996.
Find the slope of the model. Then describe what this means in terms of the rate of change of the dependent variable per unit change in the independent variable.
Y. Part 2.5
In the following Exercise, use the given conditions to write an equation for each line in point-slope form and slope-intercept form.
Passing through (-2,2) and parallel to the line whose equation is 2x - 3y = 7
Z. Part 2.1
Does f(x) mean f times x when referring to function f ? If not, what does f(x) mean? Provide an example with your explanation.