Make a normal probability plot for the given data

Assignment Help Basic Statistics
Reference no: EM131550824

Question: A distributor of spices and seasonings checks moisture content of lots of pepper that it receives from a supplier. The company's specifications on moisture content are from 9 % to 12 %. The following are moisture content data for 22 incoming pepper lots (in %). The data are not listed according to production or arrival order.

223_11.5.png

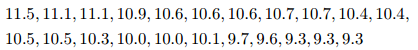
(a) Make a normal probability plot for these data. Does it appear that normal distribution is an adequate model for % moisture content in lots of pepper? Why or why not?

(b) Based on the normal probability plot in (a), estimate the mean and standard deviation of % moisture content in a pepper lot.

(c) Make a dot plot for these data.

(d) Make a histogram for these data using 9.25 to 9.49, 9.5 to 9.74, 9.75 to 9.99, 10.0 to 10.24, . . . .., 11.5 to 11.75 as the "bins."

(e) Make a box plot for these data.

(f) Give the first quartile, median, and third quartile for these data. (g) Find the interquartile range for this set of data.

Reference no: EM131550824

Questions Cloud

How much does a share of preferred stock cost today : If the market requires a 6 percent return on this investment, how much does a share of preferred stock cost today?
What is the ytm : The bonds make semiannual payments. If these bonds currently sell for 98.6 percent of par value, what is the YTM?
Identifying if the research problem : Which design is most appropriate? Which design will provide you with results to directly address your research problem - List a research method
List the numerous communication channels that are used : Assignment: Social Marketing and Healthcare- List the numerous communication channels that are used in developing a health campaign.
Make a normal probability plot for the given data : A distributor of spices and seasonings checks moisture content of lots of pepper that it receives from a supplier. The company's specifications on moisture.
Compute the present value of a debt : 1. Compute the present value of a debt of $708.13 eighty days before it is due if money is worth 5.3%.
Explain how technological advancements have changed : Research and explain how technological advancements during your lifetime have changed how the industry or field operates.
Brief summary and response to the readings : Brief summary and response to the readings assigned for the designated weeks your assignment is due -book is Contemporary Issues
Tell-tale signs of deception : One of our reading for this week is "The 10 Tell-Tale Signs of Deception." Imagine you are interviewing someone you suspect of committing a fraud.

Reviews

Write a Review

Basic Statistics Questions & Answers

  The probability of winning the local gas stations tigerama

the probability of winning the local gas stations tigerama game is 0.001. a women is determined to win. what is her

  The normality assumption states that the population of x

the normality assumption states that the population of x and y scores form a bivariate two variable normal distribution

  These are absolute valued tests

If you perform step 3 correctly you will get a negative value. These are absolute valued tests so Ignore the - sign. These problems depend on the same normal curve

  Explanation for independent t test with equal-uneuqal va

Discuss why the independent t-test is called independent. What does this analysis have to do with variance within and between groups?

  In a survey respondents were asked to indicate their

in a survey respondents were asked to indicate their favorite brand of cereal post or kelloggs. they were allowed only

  On a sample of 30 women and 20 men 12 men like footbaill

on a sample of 30 women and 20 men 12 men like footbaill while 15 men like football. is there evidence for gender

  What type of geometric relationship will you obtain

If a linear model is first-order in three independent variables, what type of geometric relationship will you obtain when E(y) is graphed as a function of one of the independent variables for various values of the other independent variables?

  Find optimal allocation for estimating population mean

The population consists of two strata, H and L of sizes 100,000 and 500,000 and standard deviations 20 and 12 respectively. A stratified sample of size 100 is to be taken.

  Do the data indicate a significant change in the grade

a professor in the psychology department would like to determine whether there has been a significant change in grading

  What is the explanatory variable in this study

Use the list of random digits below to assign 4 men and 2 women to the shark fin treatment. Read the table from left to right, first selecting the 4 men and then the 2 women. Use the numerical labels given in the chart to the names.

  Hypothesis testing of political persuasions

You are curious about whether the professors and students at your school are of different political persuasions, so you take a sample of 20 professors and 20 students drawn randomly from each population.

  The following table displays the salaries of 20 workers per

1. the following table displays the salaries of 20 workers per week210 209 212 208 217 207 210 203 208 210210199 215

Free Assignment Quote

Assured A++ Grade

Get guaranteed satisfaction & time on delivery in every assignment order you paid with us! We ensure premium quality solution document along with free turntin report!

All rights reserved! Copyrights ©2019-2020 ExpertsMind IT Educational Pvt Ltd