Reference no: EM131402974
Structurally deficient highway bridges. Refer to the data on structurally deficient highway bridges compiled by the Federal Highway Administration (FHWA), Exercise. Recall that for future planning and budgeting, the FHWA wants to estimate the total area of structurally deficient bridges in a state based on the number of deficient bridges. Use the results of the simple linear regression relating total area (y) to number of structurally deficient bridges (x) to find a 95% prediction interval for y when x = 350 bridges. Interpret the result.
Exercise
Structurally deficient highway bridges. Data on structurally deficient highway bridges is compiled by the Federal Highway Administration (FHWA) and reported in the National Bridge Inventory (NBI). For each state, the NBI lists the number of structurally deficient bridges and the total area (thousands of square feet) of the deficient bridges. The data for the 50 states (plus the District of Columbia and Puerto Rico) are saved in the FHWABRIDGE file. (The first five and last five observations are listed in the table.) For future planning and budgeting, the FHWA wants to estimate the total area of structurally deficient bridges in a state based on the number of deficient bridges.
(a) Write the equation of a straight-line model relating total area (y) to number of structurally deficient bridges (x).
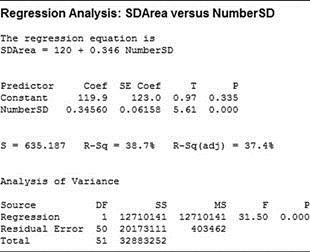
(b) The model, part a, was fit to the data using Minitab as shown in the accompanying printout. Find the least squares prediction equation on the printout.
(c) List the assumptions required for the regression analysis.
(d) Locate the estimated standard error of the regression model, s, on the printout.
(e) Use the value of s to find a range where most (about 95%) of the errors of prediction will fall.
| STATE |
NUMBER |
AREA (thousands of sq. ft.) |
| Alabama |
1899 |
432.7 |
| Alaska |
155 |
60.9 |
| Arizona |
181 |
110.5 |
| Arkansas |
997 |
347.3 |
| California |
3140 |
5177.9 |
|
.
.
.
|
|
|
| Washington |
400 |
502 |
| West Virginia |
1058 |
331.5 |
| Wisconsin |
1302 |
399.8 |
| Wyoming |
389 |
143.4 |
| Puerto Rico |
241 |
195.4 |
|
Calculate the percentage 12-month growth rates
: Calculate the percentage 12-month growth rates in the index of industrial production and in the money supply, and graph these.
|
|
How healthcare managers begin to operate within annual cycle
: It is important to understand the annual calendar of healthcare finance. Truly, everything that happens in this field is an annual cycle. Describe how healthcare managers begin to operate within this annual cycle?
|
|
Find a phillips curve relation or a reverse phillips curve
: Calculate the 12-month percentage increase in the consumer price index (CPI), and plot this, along with the unemployment rate. Do you observe a positive correlation, a negative correlation, or a correlation that is essentially zero? Can you find a..
|
|
Informal and formal learning opportunities
: You want to encourage your staff to be creative and innovative. What informal and formal learning opportunities might you provide them with to help them develop the skills needed for innovation? Provide at least five examples
|
|
Locate the estimated standard error of the regression model
: List the assumptions required for the regression analysis.- Locate the estimated standard error of the regression model, s, on the printout.
|
|
What are key business cycle regularities in the labor market
: Describe the key business cycle regularities in consumption and investment expenditures.
|
|
What would you do if you were in clyde and fresnos shoes
: What will they have to prove? Is there a better course of action for Clyde and Fresno to follow? What would you do if you were in Clyde and Fresno's shoes?
|
|
Write program that calculates the slope and length of sides
: PROG10082 Object-Oriented Programming-I Java. You are to write a program that calculates the slope and length of sides and the perimeter of a rectangle given four of its vertices as ordered pairs (x, y)
|
|
Connecting on an emotional level
: How does emotional intelligence relate to connecting on an emotional level with someone -- through marketing especially, but also through any other means such as music or art, or business communications?
|