Reference no: EM1322554
Computing a linear regression equation to predict the future values of the dependent variable Y.
1. The estimators for the slope parameter and intercept parameter in a simple linear regression model were obtained in class using the method of Least Squares. The resulting estimators turned out to be unbiased. That is 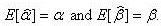 Now, suppose that in order to save some time a careless researcher decides to estimate the slope parameter by connecting the fifth sample point collected (X5, Y5) by a straight line to the thirteenth sample point collected (X13, Y13) and then using the slope of this line to estimate . Suppose we call this estimator *. Is * an unbiased estimator of ? That is, is it true that E [ *] = ?
1. The estimator is not unbiased and the bias is σ2.
2. The estimator is not unbiased and the bias is the mean square error, MSE.
3. The estimator is not unbiased and the bias is the sample variance of the n-2 points not included in the calculation of the slope.
4. The estimator is unbiased.
5. The estimator is not unbiased, but the bias cannot be obtained in closed form. It depends on where among the scatter plot of points the two points (X5, Y5) and (X13, Y13) happen to lie.
6. It cannot be determined from the information given.
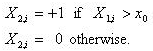
2. Suppose that you wish to use a linear regression to predict the dependent variable Y using the dependent variable X1. You collect a scatter plot of points (X1,i ,Yi) and notice that the plot seems to be well represented by a piecewise continuous linear function that satisfies the following conditions: For X1i≤X0 the appropriate linear model appears to be Yi= α +β1 X1i + ?i. However, whenX1i>X0 the slope of the applicable linear relationship appears to change to β1 + β2.Hint: First, determine the applicable form of the linear model that represents the plot of points (X1,i ,Yi) when X1i>X0 and note that both the slope and Y-intercept of the model will differ from the model applicable to the set of points (X1,i ,Yi) when X1i≤X0. Now see if you can devise a way to combine these two linear relationships into a single multiple regression model by using the indicator variable X2i where
1. There is no way to combine these two linear relationships into a single multiple regression. You should instead run each regression separately as simple regressions.
2. The combined model is: Yi= α + β1X1i + β2X1iX2i + ?i.
3. The combined model is: Yi= α + β1X1i + β2(x0 -X1i)X2i + ?i.
4. The combined model is Yi= α + β1X1i + β2(α - x0 -X1i)X2i + ?i.
5. The combined model is Yi= α + β1X1i + β2(X1i - x0)X2i + ?i.
|
Inherent constitutional authority
: Was the US-Canadian agreement valid under the US Constitution? Was the president acting under his inherent constitutional authority, under power delegated from Congress, or neither? What did Congress say the president could do to restrict agricult..
|
|
Find whether or not to support the claim
: Using one proportion z test to find whether or not to support the claim - There is little evidence to reject H 0 , therefore they conclude the tvs are 20 pounds on average.
|
|
How long after its release does the mailbag reach
: A 27 pound meteorite struck a car, leaving a dent 26cm deep in the trunk. If the meteorite struck the car with a speed of 620m/s, what was the magnitude of its deceleration, assuming it to be constant.
|
|
Case study of pacific express
: Pacific Express began operating as an airline in 1982. It had routes connecting western cities with Los Angeles and San Francisco and by the summer of 1983 was beginning to show a profit.
|
|
Linear relationships into a single multiple regression
: Computing a linear regression equation to predict the future values of the dependent variable Y - Linear relationships into a single multiple regression.
|
|
Molecules between bubble and the surrounding water
: The intersection is 15 m wide. Her car's maximum deceleration is -6.8m/s2, whereas it can accelerate from 43km/h to 70km/h in 8.1 s. Overlook length of her car and her reaction time.
|
|
What is the direction of the displacement
: An explorer in dense jungles of equatorial Africa leaves his hut. He takes 41 steps at an angle 45 north of east, then 81 steps at an angle 60 north of west, then 51 steps due south. Suppose his steps all have equal length. Save him from becoming ..
|
|
What is direction of the frictional force
: A Sphere on a Horizontal Surface starts from Rest. If the Force is applied facing to the Right at the Top furthest Point of the Sphere from the Horizontal Surface, the Sphere will start experiencing Roll and Slip at the same time. In which directi..
|
|
What is its average acceleration in this time interval
: An ocean liner leaves New York City and travels 16.10 ° north of east for 234 km. How far east and how far north has it gone? In other words, what are the magnitudes of components of the ship's displacement vector in directions (a) due east and (b..
|