Reference no: EM13213
Task 1:
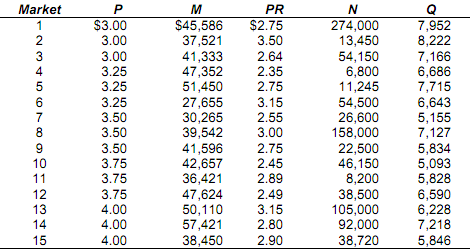
Ozark Bottled Water Products, Inc. hired a marketing consulting firm to perform a test marketing of its new brand of spring water called Liquid Ozarka. The marketing experts selected 15 small and medium-sized towns in Arkansas and Missouri for a one-month-long sales test. For one month, Liquid Ozarka was sold at a variety of prices ranging from $3 per gallon to $4 per gallon. Specifically, in three of the markets, price was set by the marketing experts at $3 per gallon. In three more markets, price was set at $3.25 per gallon, and so on. The prices charged in each market (P) are shown in the table below. For each of the 15 market areas, the marketing consultants collected data on average household income (M), the population of the marketing area (N), and the price of a rival brand of bottled water (PR). At the end of the month, total sales of Liquid Ozarka (Q) were tabulated to provide the following data from which the consultants estimated an empirical demand function for the new product.

Using the marketing data from the 15 test markets shown above, estimate the parameters of the linear empirical demand function:
Q = a+Pb + cM + dPR + eN
If any of the parameter estimates are not significant at the 2 percent level of significance, drop the associated explanatory variable from the model and estimate the demand function again.
i) Your estimated linear demand function for Liquid Ozarka is
ii) What percentage of the variation in sales of Liquid Ozarka is explained by your estimated demand function?
The marketing consultants describe a "typical" market as one in which the price of Liquid Ozarka is $3.50 per gallon, average household income is $45,000, the price of rival bottled water is $3 per gallon, and the population is 75,000. Answer the following questions for this "typical" market scenario.
iii). What is the estimated elasticity of demand for Liquid Ozarka? Is demand elastic or inelastic? What would be the percentage change in price required to increase sales of Liquid Ozarka by 10 percent?
iv). What is the estimated income elasticity of demand? Is Liquid Ozarka a normal or inferior good? A 6 percent increase in average household income would be predicted to cause what percentage change in sales of Liquid Ozarka?
v). What is the estimated cross-price elasticity of demand for Liquid Ozarka with respect to changes in price of its rival brand of bottled water? Does the estimated cross-price elasticity have the expected algebraic sign? Why or why not? If the price of the rival brand of water rises by 8 percent, what is the estimated percentage change in sales of Liquid Ozarka?
Using the marketing data from the preceding 15 test markets, estimate the parameters for the log-linear empirical demand function:
Q = a + bP + cM +dPR + eN
If any of the parameter estimates are not significant at the 2 percent level of significance, drop the associated explanatory variable from the model and estimate the demand function again.
vi). Does a log-linear specification work better than a linear specification of demand for Liquid Ozarka? Explain by comparing F-ratios, R2 s, and t-ratios (or p-values).
vii). Using the estimated log-linear demand function, compute the price, income, and cross-price elasticities of demand. How do they compare to the estimated elasticities for the linear demand specification?
Task2:
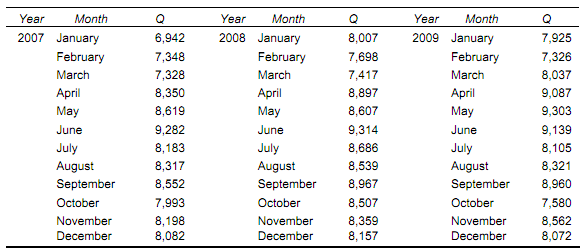
For 2007-2009, Gallaway, Inc. has collected the following data on monthly sales of its Titan II driving club, where Q = the number of units sold per month.

i). Management at Gallaway is concerned about sales. They would like to know if there is an upward trend is sales of the Titan II. Use the data above to estimate the monthly trend in sales using a linear trend model of the form:
Qt = a + bt . Does your statistical analysis indicate a trend? If so, is it an upward or downward trend and how great is it? Is it a statistically significant trend (use the 5 percent level of significance)?
ii). Now adjust your statistical model to account for seasonal variation in club sales. Estimate the following model of sales:
Qt = a + bt + c1D1t + c2D2t + c3D3t
where D1t = 1 for the months of January-March or 0 otherwise,
D2t = 1 for the months of April-June or 0 otherwise, and D3t = 1 for the months of July-September or 0 otherwise. Do the data indicate a statistically significant seasonal pattern (use the 5 percent level of significance)? If so, what is the seasonal pattern of sales of Titan II clubs?
iii). Comparing your estimates of the trend in sales in parts a and b, which estimate is likely to be more accurate? Why?
iv). Using the estimated forecast equation from part b, forecast sales of Titan II clubs for January 2010, January 2011, July 2010, and July 2011.