Reference no: EM13121460
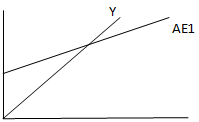
1. Using the graph, show what happens to the aggregate expenditures curve (AE1) when autonomous expenditures fall (to AE2).
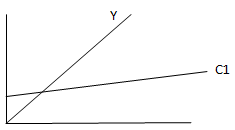
2. Using the graph, draw consumption curve C2 showing what happens to equilibrium income when the marginal propensity to consume (in C1) rises (to C2).
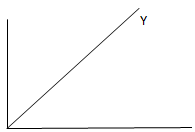
3. The marginal propensity to consume is .7 and autonomous expenditure is 4,000. What is the level of equilibrium income in the economy? Demonstrate graphically. Show all relevant labels.
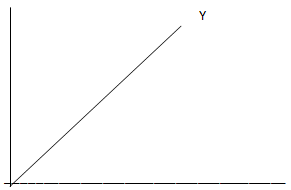
4. If C = 20 + .7Y, compute the multiplier (M). Explain the economic meaning of the multiplier. Show all formulas and calculations
5. If C = 90 + .8Y; I = 20; and G = 10,
(a) What is the value of the marginal propensity to expend (MPE)? How do you know this?
(b) What is the meaning of the MPE?
(c) Write the full AE equation, and
(d) Draw the curve that represents AE. Be as precise and detailed as possible.
6. Consumption has two components: The autonomous part and the induced part (related to income). If C = 40 + .75Y,
a. What is the value of the autonomous consumption?
b. What is the value of the induced consumption if Y = 100?
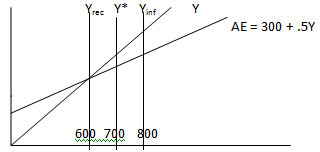
7. Based on the information on the graph below and the fact that Y = M x AE
a. If potential output (Y*) is 700, what is the amount of the recessionary gap? (10points)
b. Find the increase in autonomous spending needed to bring the economy to full potential Y by applying an expansionary fiscal policy (reducing taxes). Show all formulas, terms, and calculations.
8. What do we have to watch for when giving a tax reduction (to consumers) in order to increase autonomous spending to bridge the recessionary gap?