Reference no: EM131702
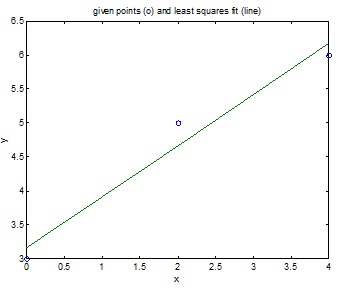
If A is an m by n rectangular matrix with m >= n and if c is a vector with n components then A c = y can not usually be solved exactly. Matlab can solve these equations approximately with the command c = A \ y. The solution c is called the "least squares" solution for reasons that we will describe later in the course. To illustrate an application involving this use of a rectangular matrix suppose that we wish to fit the three points (0,3), (2,5), and (4,6) with a straight line. Then as we described earlier we can let the line be described by c1' + c2 x, let c = [ c1 ; c2] (using Matlab notation for vectors), let y = the vector of y values.and let A be a Vandermonde matrix with components aij= xIj-1 . To fit the line to the data we need to try to solve the equation A c = y.. In this example one can create A with the Matlab command A = [ 1 0;1 2;1 4] and y with y = [3 ; 5; 6]. Then c = A \ y gives c = [3.1667; .75]. The commands
x=[0; 2; 4] % x isthe vector of x coordinates
plot(x,y,'o',x,A*c) % note that A*c generates points on the best fit line
xlabel('x')
ylabel('y')
title('given points (o) and least squares fit (line)')
will plot the given points and the line 3.1667 + .75 x. See the figure below.
For homework consider the points (0,0), (1,2), (2,3), (3,9), ( 4,17), (5,24), (6,37). (1) Use Matlab to find the least squares best fit with a line. Turn in A, y and c and a plot like the one above. Also (2) use Matlab to find the least square best fit with a quadratic. Turn in the same information.

|
Filtering and summarizing data
: Filtering and Summarizing Data
|
|
Identify and describe the organizational authentication
: Identify and describe the organizational authentication technology and network security issues
|
|
Health economics assignment
: Health economic theory and practice
|
|
Evaluate the correlation coefficient
: Evaluate the correlation coefficient.
|
|
Least squares
: For homework consider the points (0,0), (1,2), (2,3), (3,9), ( 4,17), (5,24), (6,37). (1) Use Matlab to find the least squares best fit with a line. Turn in A, y and c and a plot like the one above. Also (2) use Matlab to find the least square best..
|
|
Calculate the correlation coefficient
: Calculate the correlation coefficient
|
|
The problem of operating a warehouse
: Consider the problem of operating a warehouse, by buying and selling the stock of a certain commodity, in order to maximize profit over four periods.
|
|
Create a multi-threaded competition
: Create a multi-threaded competition
|
|
Evaluate particle diameter at different gas velocities
: Evaluate particle diameter at different terminal gas velocities
|