Reference no: EM132800850
ISYS3375 Business Analytics - RMIT University
Question 1. Open excel sheet which is called worksheet "Q1"of the Excel file (provided for this assignment) and develop the following visualizations.
a. A figure showing whether there is a relationship between age and income.
b. A figure showing distribution of income.
c. A figure illustrating registration date and frequency of people who are registered.
Question 2. Excel worksheet "Q2" is related to a financial institute that provides loans to its customers. The intention from investigating the data is to identify the customer credibility. The description of variables are presented below:
|
Variable
|
Meaning
|
|
Credibility
|
1= good
2= bad
|
|
Credit amount
|
No description needed
|
|
Length of employment
|
1= less than 20 years
2= between 20 and 40 years
3= between 40 and 60 years
|
|
Sex and Marital Status
|
1= married made
2= married female
3= divorced male or female
|
|
Age
|
Age in years
|
Considering we want to develop a model and consider credibility as a dependent variable answer the following questions:
• How many independent categorical and numerical variables exists in the data set?
• If we want to develop a logistic regression model how many coefficients would we have excluding intercept.
Question 3. The data presented in worksheet "Q3" is the results of a 4-year study conducted to assess how age, weight, and gender influence the risk of diabetes. Risk is interpreted as the probability (times 100) that the patient will have diabetes over the next 4-year period.What predictive model you suggest relating risk of diabetes to the person's age, weight and the gender. Why?
Question 4. There are 500 client records in the worksheet "Q4" of the Excel file (provided for this assignment) who have shopped many special products from an e-Business website. Each record includes data on types of product purchased (between 1-5), purchase amount ($), age, gender, family size of the customer, whether the client has a membership and whether the customer has a discount card.
a) Develop a multiple regression model to predict the spend amount based on other variables in the data set. Write the final equation and interpret the coefficients of the model and explain the accuracy of the model?
b) What would be your recommendation to improve the accuracy of this model? What is your recommendation to improve the simplicity of the model?
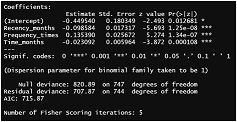
Question 5. The following screenshot is taken from the logistics regression output from a data set which can be found here. The data set is about blood donation of a center. In this data set, there are four dependent variables and one independent variable. Independent variables are explained below. Dependent variable is if another donation happened in March 2007.
R months since last donation
F total number of donation)
M total blood donated in
T months since first donation
a. Write the logistics regression equation based on the output?
b. In the Excel sheet "Q5" you can find the actual values of dependent variable versus the prediction values in the test set. Calculate overall error, sensitivity, and specificity. Explain the steps of calculations.
Question 6. Consider the following confusion matrix as the result of a logistic regression model that aims to classify a dependent variable y (whether the patient is having heart attack or not) based on a given set of independent variables. In this model, y = 1indicates having a heart attack and y = 0 indicates not having a heart attack. The cut-off value is considered as 50%.Do you think we need to make a change to the cut-off value? Justify your answer
|
R
|
months since last donation
|
|
F
|
total number of donation)
|
|
M
|
total blood donated in
|
|
T
|
months since first donation
|
Question 7. In worksheet "Q7", a dataset from blood bank is presented. The data are recorded for blood donation made by a group of donors of in a period of time. The donor ID is unique for each donor. A donor might have donated more than once in this period. At each donation, the blood total protein level of the donor has been recorded. There are some missing values for blood type. How you can fill in the missing values. Explain your approach (step by step) on how you will fill in the missing values.Apply your approach to fill the missing value as much as possible. (save the results in an Excel worksheet in and name it Question 8.)
Question 8. Open the Excel worksheetQ8. In this data set there are 12 different observations. In the same data set x and y represent independent and dependent variables, respectively. Develop a regression model which best represents the data set. You can develop a linear or a polynomial regression model. However, you cannot exceed a degree 3 exponential regression model. In other words, your options are limited to degree 1, 2 and 3 regression models.
a. Developed scatter charts to degree 1, 2 and 3 regression models and based upon the scatter plot explain which model is better.
b. What are the potential advantageous and disadvantageous of using exponential regression models of degree 6 and 7 for this data set?
c. Develop a figure(s) or table (s) which can help you in the determining which regression model has high accuracy. Note: this figure should not be a scatter plot.
Question 9. Matthew has a job as business analyst. He plans to invest 10 percent of his annual salary after the tax into a retirement account at the end of every year for the next 25 years. Suppose that annual return is 3, and his current salary before tax is 80k which grow 3% per year. The tax will apply as 15% on the salary up to 50k and it is 20% for the salary interval of 50k and 80k and the tax rate will be 25% for the remaining salary more than 80k (for example if his salary will be 105k, he is paying 15% tax on his first 50k and 20% in the next 30 k and 25% on his next 25k of his salary). then:
a) Create a spreadsheet which shows Matthew the balance of retirement account for various levels of annual investments and returns.
b) If the annual return rate is uncertain and it is between 5% to 9% in any given year (hint: use = =RANDBETWEEN(2,9)/100) what would be the expected value (average) of Matthew balance after 25 years (use the model 10 times then report the average).
Attachment:- Business analytics.rar