Introduction to probability

Assignment Help Basic Statistics
Reference no: EM13840016

Introduction to Probability

Residing in Fort Walton Beach, Florida and working at Eglin AFB. It can be a challenge to drive to each morning since the base is under construction. If there's an accident or construction being worked, this can also increase the wait time it takes me to get to work. Normally it takes a little over 15 minutes before the construction started but now it takes 20 or more minutes. For this SLP, I will be collecting variable data for 10 days on how long it takes me to drive to work each day since it can difficult at times depending on traffic.

  • Day 1 - 22 minutes - Construction
  • Day 2 - 35 minutes - Construction
  • Day 3 - 30 minutes - Construction
  • Day 4 - 28 minutes - Construction
  • Day 5 - 31 minutes - Construction
  • Day 6 - 33 minutes - Construction
  • Day 7 - 15 minutes - Normal traffic
  • Day 8 - 17 minutes - Normal traffic
  • Day 9 - 35 minutes - Accident at intersection
  • Day 10 - 18 minutes - Normal

Table 1 showing the sum of the collected wait times. Here, n=10,∑x=264.

The mean waiting time is, x ¯= (∑x)/n= 264/10 = 26.4 minutes

Table 1.

Day

Wait Time (in min)

1

22

2

35

3

30

4

28

5

31

6

33

7

15

8

17

9

35

10

18

Sum

264

Table 2 showing the ordered series (Ascending) of the collected wait times.

Table 2.

15

17

18

22

28

30

31

33

35

35

Since n=10, is even the mean of the two middle terms is the required median.

The median waiting time is, M= Mean of 5th and 6th terms in the ordered series

= (28 + 30)/2

= 29 minutes

The most frequent value of the collected wait times is 35, i.e. it was repeated 2 times. Therefore, the mode of waiting times is 35 minutes.

Since it was expected that now it takes 20 or more minutesto get to work if there's an accident or construction being worked, the three measures obtained here support the expectations.

Among the calculated 3 measures of central tendency, the mean is the most accurately describes the variable under study. Since the variable wait time is measured on continuous ratio scale, the arithmetic mean is an appropriate measure to describe the central tendency.

Chart 1 contains the box-plot of the collected 10 wait times.

1730_box-plot.jpg

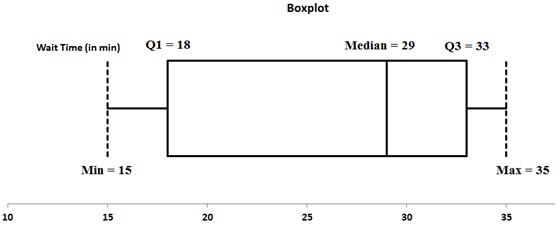
The box-plot depicts that the distribution of wait times is skewed to its left. The values of mean, median and mode (26.4 < 29 < 35) also indicated the same.

Continuing with the data, write a paper (1-3 pages) including all of the following content:

• Include your data from Module 1.

• Create a frequency distribution table for your data. You can use Excelor Word.

• Calculate the standard deviation.

• Calculate the variance.

• Is this a normal distribution? How do you know?

• What are the implications?

Reference no: EM13840016

Questions Cloud

What backs our money supply : Everyone loves to learn about money. There are many interesting questions and issues. What backs our money supply. What role is played by gold. Are credit cards considered money. Should we get rid of the penny.
What product line to pursue? : What product line to pursue?
Predict future interest rates and reflect the trends : Stock prices are useful as a leading indicator. To explain this phenomenon, which of the following is most accurate? Stock prices: Predict future interest rates and reflect the trends in other indicators. Do not predict future interest rates, nor are..
Determine the inverse dtft y[n] of y(e^jw) : Let X(e^jw) denote the DTFT of a real sequence x[n]. Define Y(e^jw)=1/2{X(e^jw/2)+X(-e^jw/2)} Determine the inverse DTFT y[n] of Y(e^jw).
Introduction to probability : Residing in Fort Walton Beach, Florida and working at Eglin AFB. It can be a challenge to drive to each morning since the base is under construction. If there's an accident or construction being worked, this can also increase the wait time it ta..
How to test electrical and electronics components : How to test Electrical and Electronics Components and Devices with Multimeter ? (with easy expalantion )
How does expansionary fiscal policy affect aggregate demand : Under what conditions would the government choose to implement expansionary fiscal policy. How does expansionary fiscal policy affect Aggregate Demand. Use an example from U.S. history to illustrate how expansionary fiscal policy affects the econo..
Why radio waves are chosen for remote & close : Why radio waves are chosen for Remote & close range transmission? and how HOW TO CONSTRUCT A SIMPLE RADIO RECEIVER ?
Competitive strategies and government policies : Competitive Strategies and Government Policies

Reviews

Write a Review

Basic Statistics Questions & Answers

  Statistics-probability assignment

MATH1550H: Assignment:  Question:  A word is selected at random from the following poem of Persian poet and mathematician Omar Khayyam (1048-1131), translated by English poet Edward Fitzgerald (1808-1883). Find the expected value of the length of th..

  What is the least number

MATH1550H: Assignment:  Question:     what is the least number of applicants that should be interviewed so as to have at least 50% chance of finding one such secretary?

  Determine the value of k

MATH1550H: Assignment:  Question:     Experience shows that X, the number of customers entering a post office during any period of time t, is a random variable the probability mass function of which is of the form

  What is the probability

MATH1550H: Assignment:Questions: (Genetics) What is the probability that at most two of the offspring are aa?

  Binomial distributions

MATH1550H: Assignment:  Questions:  Let’s assume the department of Mathematics of Trent University has 11 faculty members. For i = 0; 1; 2; 3; find pi, the probability that i of them were born on Canada Day using the binomial distributions.

  Caselet on mcdonald’s vs. burger king - waiting time

Caselet on McDonald’s vs. Burger King - Waiting time

  Generate descriptive statistics

Generate descriptive statistics. Create a stem-and-leaf plot of the data and box plot of the data.

  Sampling variability and standard error

Problems on Sampling Variability and Standard Error and Confidence Intervals

  Estimate the population mean

Estimate the population mean

  Conduct a marketing experiment

Conduct a marketing experiment in which students are to taste one of two different brands of soft drink

  Find out the probability

Find out the probability

  Linear programming models

LINEAR PROGRAMMING MODELS

Free Assignment Quote

Assured A++ Grade

Get guaranteed satisfaction & time on delivery in every assignment order you paid with us! We ensure premium quality solution document along with free turntin report!

All rights reserved! Copyrights ©2019-2020 ExpertsMind IT Educational Pvt Ltd