Reference no: EM132172661
Econometrics Assignment -
Part 1 -
1. Using annual data on output and labor and capital outputs for the United States for the period 1929-1967, the production function, ln Yt = β0 + β1 ln Labt + β2Capt + ut has been estimated by employing ordinary least square method and results obtained are given below:

(i) Using an appropriate test statistic test whether labor and capital elasticities of production are statistically significant, clearly stating appropriate null and alternative hypotheses.
(ii) Test the null hypothesis that the sum of the labor and capital elasticities are equal to unity, β1+β2=1, and interpret your result.
(iii) Test the significance of R2, clearly stating your null and alternative hypotheses.
(iv) Using economic and statistical criteria, interpret the results of Cobb-Douglas production function.
2. In Table 7.11, you are provided with data for manufacturing sector of the Greek economy for the period 1961-1987:
(a) Using ordinary least square method, estimate the Cobb-Douglas production function (Yt =ALabtβ_2Captβ_3eu_t) using the data on output, labor inputs and capital inputs about the Greek economy as given in Table 7.11. Also estimate the variance-covariance matrix of the regression coefficients. Explain if the data fits well and interpret the results. What general conclusion do you draw?
(b) Now consider the following regression model:
Output/Labor = A(Cap/Lab)βue
Where the dependent variable represents labor productivity and the independent variable represents the capital labor ratio. What is the economic significance of such a relationship, if any? Estimate the parameters of this model and interpret your results. (Hint: Use the F-statistic to test the null that H0: β2 = 1-β3).
3. The demand for money model was tested for Japan using quarterly data over the period 1982 -1994 and the results obtained are given below
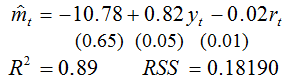
where m is (the log value of) the real money supply, y is (the log value of) the real income, r is the interest rate.
(i) Using the t-statistic test whether the coefficients of the money demand function are statistically significant, clearly stating the null hypothesis, the significance level and the critical value for t-statistic.
(ii) Testing the significance of R2, clearly stating your null hypothesis, the significance level and the critical value for the test statistic.
(iii) Based on a priori economic expectations, statistical tests and goodness of fit, explain whether the OLS estimates of the parameters are consistent with the money demand model.
(iv) The demand for money model was re-estimated for two sub-samples, 1982Q1-1988Q2 and 1988Q3-1994Q4 and sum of squared residuals were estimated to be RSS1 = 0.034921 and RSS2 = 0.024992 respectively. Test the null hypothesis that regression estimates of the parameters for sub-samples are not significantly different.
4. Consider an equation to explain salaries of CEO's in terms annual firm sales, return on equity (roe, in percentage form), and return on the firm's stock (ros, in percentage form):
logsalary = β0 + β1log(sales) + β2roe + β3ros + u
(a) In terms of the model parameters, state the null hypothesis, after controlling for sales and roe, ros has no effect on CEO's salary. State the alternative that better stock market performance increases a CEO's salary.
(b) Using data on CEO's salaries, sales, roe and ros of 209 companies, the following equation was obtained by OLS:
log((salary)^) = 4.32 + 0.280log(sales) + 0.0174roe + 0.00024ros + u
R2 = 0.283
(i) Interpret the preceding regression taking into account any prior expectations that you may have about the expected signs of the various coefficients.
(ii) By what percentage is salary predicted to increase if ros increases by 50 points? Does ros have practically large effect on salary?
(iii) Test the null hypothesis that ros has no effect on salary against the alternative that ros has a positive effect (Hint; use one-tailed t-statistic at the 5% significance level).
(iv) Would you include ros in a final model explaining CEO compensation in terms of firm performance? Explain
(v) What the overall significance of the regression? Which test do you use and why?
(vi) Can you interpret the coefficients of roe and ros as elasticity coefficients? Why or why not?
5. You are provided with the following OLS estimates of hourly wage determination equation, where log (wage) is hourly wage, educ (years of education), exper (years of labor market experience) and tenure (years with the current employer):
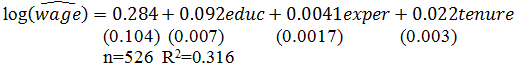
(a) Test the null hypotheses that βeduc = 0; βexper = 0 and βtenure = 0 against the alternative hypothesis that βeduc> 0; βexper > 0; βtenure > 0. What is the one-tailed critical value of the t-statistic at the 5% significance level? Show if you reject or accept the null hypotheses at this significance level.
(b) Explain if the OLS estimates are consistent with the wage rate determination equation. Comment on the results based on economics expectations, statistical theory and goodness of fit.
6. The following estimated equation was obtained by ordinary least squares regression using quarterly data for 1960 to 1979 inclusive (n=80):
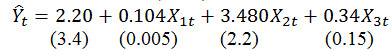
Standard errors are in parenthesis, the explained sum of squares was 112.5, and the residual sum of squares was 19.5.
(a) Which of the slope coefficients are significantly different from zero at the 5% significance level?
(b) Calculate the value of R2 for this regression.
(c) Calculate the value of adjusted R ¯2.
(d) Construct the ANOVA table and calculate the F statistic. Explain if the slope coefficients are jointly different from zero.
Part 2 -
1. A regression model in which more than one independent variable is used to predict the dependent variable is called
A. a simple linear regression model
B. a multiple regression model.
C. an independent model
D. a dependent model
2. A term used to describe the case when the independent variables in a multiple regression model are correlated is:
A. regression
B. correlation
C. multicollinearity
D. none of the above
E. none of the above
3. A multiple regression model has the form: y = 2 + 3x1 + 4x2. As x1 increases by 1 unit (holding x2 constant), y will
A. Y increase by 3 units
B. Y decrease by 3 units
C. Y increase by 4 units
D. Y decrease by 4 units
4. A measure of goodness of fit for the estimated regression equation is the
A. multiple coefficient of determination
B. mean square due to error
C. mean square due to regression
D. none of the above
5. The adjusted multiple coefficient of determination accounts for
A. the number of dependent variables in the model
B. the number of independent variables in the model
C. unusually large predictors
D. none of the above
6. The Cobb-Douglas production is a given in log-linear form as follows: lnYi = β1 + β2lnX2i + β3lnX3i +ui, where Yi is output, X2i is labor input and X3i. Which of the following statements is TRUE regarding the production function?
A. β1 is the partial elasticity of output with respect to labor.
B. β2 is the partial elasticity of output with respect to labor.
C. β2 is the partial elasticity of output with respect to capital.
D. A and B
E. B and C
7. The multiple coefficient of determination is computed by
A. dividing RSS by TSS
B. dividing TSS by RSS
C. dividing TSS by ESS
D. none of the above
8. For a multiple regression model, total sum of square (TSS) = 200 and Error sum of squares (ESS) = 50. The multiple coefficient of determination is
A. 0.25
B. 4.00
C. 0.75
D. none of the above
9. The correct relationship between total sum of squares (TSS), regression sum of squares (RSS), and error sum of squares (ESS) is given by
A. RSS = TSS + ESS
B. TSS = RSS + ESS
C. ESS = RSS - TSS
D. all of the above
E. none of the above
10. The ratio of MRSS/MESS yields
A. the t statistic
B. TSS
C. the F statistic
D. none of the above
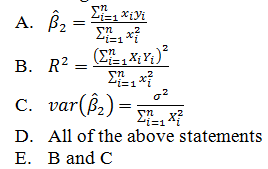
11. Suppose you estimate the regression function without an intercept term, Yi = β2Xi + ui. Which of the following statements is TRUE about its OLS estimates?
12. If the regression model you estimate is linear, that is Yi = β1 + β2Xi + ui, then β2 will be equal to
A. dY/dX
B. dY/dX X/Y
C. dX/dY
D. dY/dX Y/X
13. If the regression model you estimate is linear, that is lnYi = β1 + β2lnXi + ui, then β2 measures the elasticity of Y with respect to X and will be given by
A. dY/dX
B. dY/dX X/Y
C. dY/dX Y/X
D. dX/dY
14. In multiple regression analysis, the correlation among the independent variables is termed
A. Homoscedasticity
B. Linearity
C. Multicollinearity
D. Adjusted coefficient of determination
15. In a multiple regression model, the error term ui is assumed to
A. have a mean of 1
B. have a variance of zero
C. have a standard deviation of 1
D. be normally distributed
16. A multiple regression analysis includes 4 independent variables results in sum of squares for regression of 1400 and sum of squares for error of 600. The multiple coefficient of determination will be:
A. 0.300
B. 0.700
C. 0.429
D. 0.084
E. none of the above
17. A multiple regression analysis includes 4 independent variables results in sum of squares for regression of 2800 and sum of squares for error of 1200. If the sample size is 20, the standard error of estimate will be:
A. 8.00
B 80.00
C 140.62
D. 8.94
E. none of the above
You are given the following money demand function: ln(M/P)t = α + βlnYt + γRt + ut
18. Which of the following statements is TRUE about money demand function?
A. β and γ measure income and interest elasticities, respectively.
B. While β measures income elasticity of money demand, γ measures semi-interest elasticity.
C. Money demand theory postulate that α > 0; β > 0 and γ < 0.
D. all statements are TRUE.
E. b and c statements are TRUE.
19. Which of the following statements is TURE of the money demand model given above?
A. α + βlnYt represents the deterministic component.
B. α + βlnYt + γRt is the explained component.
C. α + βlnyt + ut represent both the explained and unexplained component.
D. All statements are TRUE.
E. b and c statements are TRUE.
20. Which of the following statements is not TRUE regarding the basic assumptions of the money demand regression model given above?
A. E(utut-j) should be equal to zero for serial correlation to exist in the model.
B. lnY and Rt should not be perfectly correlated.
C. ut should not be correlated with independent variables, lnY and Rt.
D. All statements are TRUE
E. b and c statements are TRUE.