In table 2 in p 175 hatchett and park 2004 presented the

Assignment Help Applied Statistics
Reference no: EM13379759

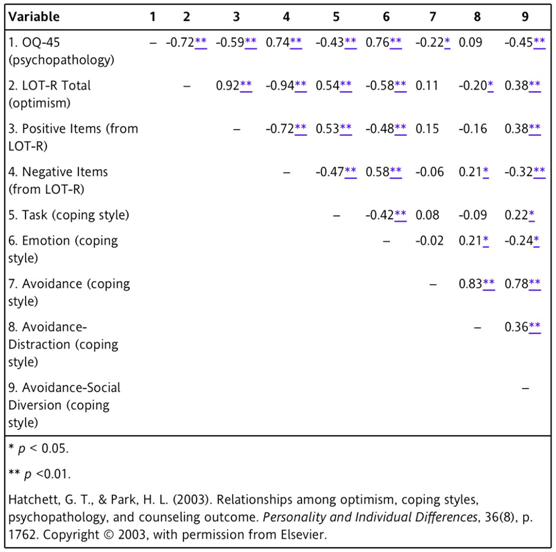
In Table 2 in p. 175, Hatchett and Park (2004) presented the correlations among optimism (LOT-R Total and Positive Items); pessimism (Negative Items); psychopathology (OQ-45); and coping styles (Task, Emotion, Avoidance, Avoidance-Distraction, and Avoidance-Social Diversion). Table 2 is a mirror-image table with the variables numbered and labeled on the y-axis and the numbers of the variables on the x-axis. The blank spaces in the table are where the variable is correlated with itself and would be a +1.00 correlation.

1. What is the r value listed for the relationship between variables 4 and 9?

2. Describe the correlation r = -0.32** using words. Is this a statistically significant correlation? Provide a rationale for your answer.

3. Calculate the percentage of variance explained for r = 0.53. Is this correlation clinically important? Provide a rationale for your answer.

4. According to Table 2, r = 0.15 is listed as the correlation between which two items? Describe this relationship. What is the effect size for this relationship, and what size sample would be needed to detect this relationship in future studies?

5. Calculate the percentage of variance explained for r = 0.15. Describe the clinical importance of this relationship.

6. Which two variables in Table 2, have the weakest correlation, or r value? Which relationship is the closest to this r value? Provide a rationale for your answer.

7. Is the correlation between LOT-R Total scores and Avoidance-Distraction coping style statistically significant? Is this relationship relevant to practice? Provide rationales for your answers.

8. Is the correlation between variables 9 and 4 significant? Is this correlation relevant to practice? Provide a rationale for your answer.

9. Consider two values, r = 0.08 and r = -0.58. Describe them in relationship to each other. Describe the clinical importance of both r values.

10. Examine the Pearson r values for LOT-R Total, which measured Optimism with the Task and Emotion Coping Styles. What do these results indicate? How might you use this information in your practice?

BONUS QUESTION

One of the study goals was to examine the relationship between optimism and psychopathology. Using the data in Table 2, formulate an opinion regarding the overall correlation between optimism and psychopathology. Provide a rationale for your answer.
985_Examine the relationship between optimism and psychopathology.png

Reference no: EM13379759

Questions Cloud

Critically discuss the effectiveness of parliamentary and : critically discuss the effectiveness of parliamentary and judicial controls over delegated legislation in the english
Prepare a proposal recommending monetary policy actions : prepare a proposal recommending monetary policy actions designed to correct problems with spending employment and
The president of the united states has been elected on the : the president of the united states has been elected on the promise of fiscal responsibility. by law he cannot reduce
What exactly is stress what is the difference between : what exactly is stress? what is the difference between so-called good stress or so-called bad stress? when it comes to
In table 2 in p 175 hatchett and park 2004 presented the : in table 2 in p. 175 hatchett and park 2004 presented the correlations among optimism lot-r total and positive items
Keays et al 2003 conducted a correlational study to : keays et al. 2003 conducted a correlational study to determine the relationship between muscle strength and functional
Galvaset industries manufactures and sells custom-made : galvaset industries manufactures and sells custom-made windows. its job casting system was designed using an
Nbsplampart co makes specialty table lamps manufacturing : nbsplampart co. makes specialty table lamps. manufacturing overhead is applied to production on a direct labor hours
Hightech inc and oldtime co complete within the same : hightech inc. and oldtime co. complete within the same industry and had the following operating results in

Reviews

Write a Review

Applied Statistics Questions & Answers

  Part i introduction this section should include some

part i introduction this section should include some perspective about the problem you are trying to analyze in other

  Write down the regression equation

Write down the regression equation and state the R-squared value and the standard error and explain what they mean with respect to the data.

  What is the importance of the decision theory

Decision Trees are graphic displays of the decision process. When do you feel it is appropriate to use decision trees?

  Question 1 1a recent study by a major financial investment

question 1 1.a recent study by a major financial investment company was interested in determining whether the annual

  What is the average number of breakdowns per day

This variable represents the number of machine breakdowns during a day, based on this simulation run, what is the average number of breakdowns per day?

  Filtering and summarizing data

Filtering and Summarizing Data

  What is the value of the test statistic and the chi-square

What is the value of the test statistic and the chi-square table, the most accurate statement that can be made about the p-value

  Problem 1the average prices for a product in twelve stores

problem 1the average prices for a product in twelve stores in a city are shown

  Westhouser paper company

Westhouser believes that it on make $650.000 from alternative Investments. What should the company do - houscr does not take advantage of Its current op-don, it can attempt to buy the land at the beginning of June or the beginning of July. provided ..

  Question 1 the manager of a cosmetics company was

question 1 the manager of a cosmetics company was interested in new zealanders personal hygiene. a survey was conducted

  Calculate the median for the group of results

State the five types of central tendency in general use. Which of these are most frequently used in SPC work and calculate the median for the group of results tabulated below: 1,3,4,6,7,9,11,14,16,17,18.

  How much revenue would be made

How much of each product do you recommend be produced that you believe maximizes revenue? How much revenue would be made if they followed your recommendation?

Free Assignment Quote

Assured A++ Grade

Get guaranteed satisfaction & time on delivery in every assignment order you paid with us! We ensure premium quality solution document along with free turntin report!

All rights reserved! Copyrights ©2019-2020 ExpertsMind IT Educational Pvt Ltd