Reference no: EM133302077
Part 1:
Assignment 1
Consider the data set D = {(xn, tn)}Nn=1, where the ordered pairs are formed by feature vectors xn ∈ Rd and labels tn ∈ {-1, +1}. By Bayes Theorem we have that the posterior probability P(t|x) for the class t is given by:
P(t|x) = P(x|t)P(t)/P(x| - 1)P(-1) + P(x| + 1)P(+1)
where the priors P(t) satisfy that P(-1) + P(+1) = 1. If we model the distri- bution of features inside class t by a Gaussian distribution with mean µt and covariance matrix Σt,demonstrate that:
1. The function σ : Rd → {-1, 0, 1} defined as:
σ(x) = sgn(log P(x| + 1) - log P(x| - 1) + log P(+1)/1-P(+1) where sgn(x) = 1 if x > 0, -1 if x < 0, and 0 otherwise, is a discriminant function.
2. The boundary of classification is a determined by a quadratic form.
covariance matrix, i.e. Σ+1 = Σ-1 = Σ then the boundary of classification. If the dispersion of points inside each class can be described by the same tion is given by the linear equation
0 = wTx + w0,
where
w = Σ-1(µ+1 - µ-1)
w0 = -1/2 [µT+1Σ-1µ+1
- µT-1Σ-1µ-1] + log P(+1)/1-P(+1).
Hint: The multivariate Gaussian centered at µt with covariance Σt is given by the expression:
P(x|t) = 1/(2Π)d/2√det(Σ) exp {-1/2(x-ut)TΣ-1(x - µt)}
Assignment 2
Four temperature censors were tted in the four corners of a room. Each of them take a temperature reading every 30 minutes. There is a door in the front of the room, that we suspect was opened at some point during the measurement. Your task is to determine, by using PCA and K -means, whether the door was open or not. The measurements were stored in the le 'room-temperature.csv'. Each line of the le is composed by ve entries, a time-stamp and readings from four sensors: front-left reading, front-right reading, back-left reading, and back-right reading.
1. Load the le 'room-temperature.csv' and plot the readings against time (do not use the time-stamp, use the order index as time variable).
2. Proceed to the PCA analysis keeping the components responsible for 93% of the variance. Plot these two components against time.
3. Plot the readings of the back-left sensor against the fron-left sensor and the readings of the back-right sensor against the front-right sensor. Discuss your observations.
4. Perform a K-means test for k = 2, 3, 4, 5 and, by using a suitable criterion, decide which k better represents the data.
5. Did somebody open the door during the measurement? Why?
Assignment 3
Question 1. Show that for the polynomial kernel function K : R2 × R2 → R defined as
K(x, y) = (xTy + 1)2
can be expressed as
K(x, y) = φ(x)Tφ(y),
where φ : R2 → R6 is defined by:
φ(x) = 
Question 2. Consider the le 'support.csv'. In each of its 3000 rows you may nd the coordinates of a point in R2 and its classi cation (+1 or -1). Plot the points on a scatter graph and decide whether the problem is linearly separable or not.
Question 3. By using the kernel function described in item 1, nd the vector wY by training a Support Vector Machine that reproduces the correct classification.
Hint: You may use packages like SciKit-Learn to perform this last task.
Part 2: Multilayer Networks and EBP
(a) Given the dataset in the le 'cloud.dat', formed by 1000 two-dimensional vectors rT = (x, y), construct and train a neural network that models the probability density (y x). Report your results in form of graphs of the parameters of your models vs the variable x.
Hint: Consider a mixture model of the form:
P(y|x) = α1(x)N (y|µ1(x), σ12 (x)) + α2(x)N (y|µ2(x), σ22 (x)),
where 0 < αi < 1 and α1 + α2 = 1 for all x.
(b) Use the maximum likelihood principle to nd the values of the parameters r0 and σ2 in the following model:
P(r) = 1/2Π.1/√2Πσ2 exp{-1/2 (r - r0)2/σ2 ,
where r = x2 + (y-1)2.
Optimization:
Consider the functional entropy defined as
S[p] ≡ - ∫dxp(x) log p(x)
where p(x) is a well defined probability density for x∈R+U{0}. Suppose that all the knowledge we have about p(x) is summarized in the following properties:
1 = ∫ dxp(x)
µ = ∫ dxp(x)x
where µ∈R is known. By using the de nition of the functional derivative of a functional F (introduced in lecture 7):
δF[p]/δp(x0) ≡ d/dλ.F[p(x) + λδ(x - x0)]λ=0
where p is a suitable probability density, λ ∈ R is a real number and δ(x - x0) is the Dirac's delta function centered at x0, demonstrate that the probability density that minimizes the functional entropy (1) subject to the constraints (2) and (3) is an exponential distribution:
P(x|µ) = 1/µ.e-x/µ.
3. Radial Basis Functions and Regularization
|
x
|
y
|
|
0
|
0.4556
|
|
0.1
|
0.8110
|
|
0.2
|
0.9515
|
|
0.3
|
0.8871
|
|
0.4
|
0.8281
|
|
0.5
|
0.4509
|
|
0.6
|
0.2219
|
|
0.7
|
0.1530
|
|
0.8
|
0.1501
|
|
0.9
|
0.2019
|
|
1.0
|
0.5981
|
Table 1: Data set for problem 3 b).
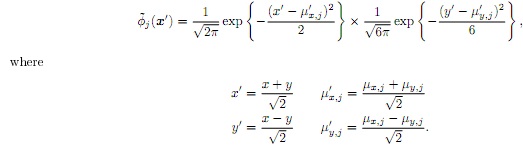
(a) Consider general Gaussian basis function of the form:
φj(x) =1/2Π √det(Σ) exp {-1/2 (x - µj)TΣ-1(x - µj)}
Σ = 
Show that the mapping represented by such a network is equivalent to a that of a function:
(b) Implement the radial basis network function with Gaussian kernels (with variance σ2 = 0.1)) that interpolates the data set presented in Table 1.