Reference no: EM132526250
IFYEC002 Economics - Northern Consortium UK
Question A1
The equilibrium market price can be defined as the price at which
a) producers maximise their profits.
b) positive excess demand equals negative supply.
c) the market for the product clears.
d) the price elasticity of demand equals the elasticity of supply.
Question A2
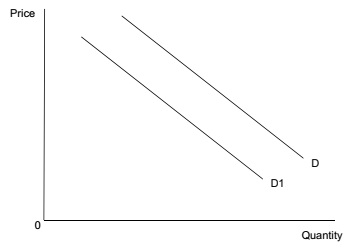
The diagram below shows the demand curve for compacts discs (CD's).
The shift of the curve from D to D1 would most likely have been caused by
a) a fall in the price of compact discs.
b) a rise in the price of compact discs.
c) a rise in wages of workers in the compact discs industry.
d) a rise in the price of compact disc players.
Question A3
The table below shows indices of labour productivity for two firms between 2013 and 2016.
|
|
Index of Labour productivity (2015 = 100)
|
|
Year
|
Firm X
|
Firm Y
|
|
2013
|
150
|
120
|
|
2014
|
120
|
110
|
|
2015
|
100
|
100
|
|
2016
|
80
|
80
|
Which one of the following can be concluded from the data?
a) Productivity in both Firms X and Y was in equilibrium in 2015.
b) Labour productivity was identical in both Firms X and Y in 2016.
c) Labour productivity fell at a faster rate in Firm X than in Firm Y between 2013 and 2016.
d) Firm X had a higher level of labour productivity than Firm Y in 2013.
Question A4
Which one of the following is most likely to shift an economy's short-run aggregate supply curve to the left? A rise in
a) wage rates.
b) labour productivity.
c) consumption.
d) the money supply.
Question A5
Which one of the following is an appropriate form of government intervention for the problem identified?
a) The use of a tax to stabilise the price of a public good
b) The provision of a subsidy for a product which generates negative externalities.
c) The introduction of pollution permits to limit negative externalities
d) The imposition of a maximum price for a merit good above its free market price.
Question A6
Saving in an economy is most likely to increase, all other things being equal, if
a) there is a rise in unemployment.
b) there is a rise in interest rates.
c) there is a rise in prices.
d) business confidence is rising.
Question A7
The diagram below shows the demand and supply curves of blueberries in the UK, where X is the initial equilibrium.
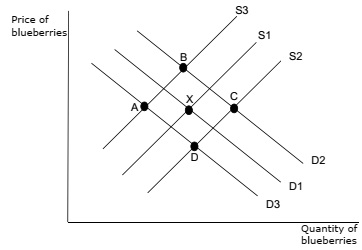
If there is a rise in the number of people eating blueberries following media reports of the fruits' health benefits, and at the same time, there is a fall in productivity in the blueberry industry, where will be the new equilibrium?
a) A
b) B
c) C
d) D
Question A8
Supply-side policies are aimed mainly at
a) reducing cyclical unemployment.
b) reducing a country's national debt.
c) improving aggregate demand.
d) improving the underlying trend rate of growth.
Question A9
The diagram below shows the production possibility boundaries for Countries S and T respectively
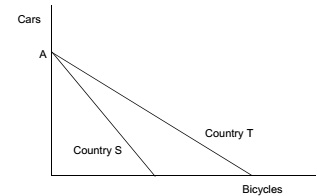
The opportunity cost of cars in terms of bicycles
a) increases as more cars are produced.
b) increases as more bicycles are produced.
c) is greater for Country S than for Country T.
d) is greater for Country T than for Country S.
Question A10
The diagram below shows a country's aggregate demand and supply curves, with equilibrium at point E.
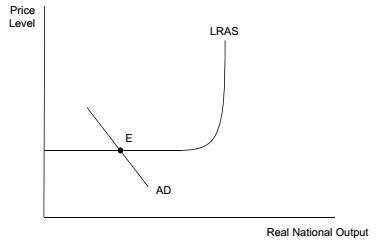
Which of the following will be least likely to be occurring in the economy?
a) Inflationary pressure.
b) Rising unemployment.
c) Positive output gap.
d) Am improving balance of payments deficit.
Question A11
If the price elasticity of supply of a good is +4.0 and its price increases by 10%, the increase in quantity supplied is
a) 40%
b) 25%
c) 2.5%
d) 0.4%
Question A12
The diagram below shows the growth rate of an economy over time.
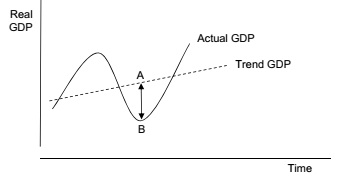
The distance AB is known as
a) positive output gap.
b) the level of unemployment.
c) negative output gap.
d) economic recovery.
Question A13
The table below shows the marginal private and external benefits and the marginal private and external costs of two products at their free market equilibrium level of output.
|
|
Product A (£)
|
Product B (£)
|
|
Marginal private benefit
|
180
|
170
|
|
Marginal external benefit
|
55
|
140
|
|
Marginal private cost
|
190
|
170
|
|
Marginal external cost
|
85
|
130
|
To improve the allocation of resources, what should the government do?
a) Subsidise product A and subsidise product B
b) Tax product A and tax product B
c) Subsidise product A and tax product B
d) Tax product A and subsidise product B
Question A14
The following diagram shows the different costs curves faced by a firm.
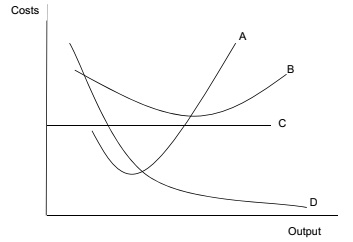
Which curve represents marginal costs?
a) A
b) B
c) C
d) D
Question A15
Which of the following is the most likely determinant of the elasticity of demand of a good?
a) The price elasticity of supply of the good.
b) The availability of complementary goods.
c) The price of the good.
d) The availability of substitutes.
Question A16
The diagram below shows the marginal private benefit and the marginal social benefit (MPB and MSB) curves and the marginal private cost and the marginal social cost (MPC and MSC) curves for cigarettes. The free market level of output is Q1 at price P1.
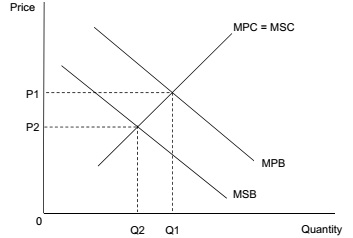
In the absence of government intervention, a misallocation of resources is likely to occur because
a) there is over-production of 0Q2.
b) the market price is too high.
c) there is over-consumption of Q2-Q1.
d) the market output is too low.
Question A17
Which one of the following is a correct statement?
a) The Bank of England is responsible for fiscal policy.
b) Fiscal policy is only used to affect the demand side of the economy.
c) The government uses fiscal policy to control the exchange rate.
d) Fiscal policy can be used to affect the pattern of economic activity.
Question A18
Which combination of the following are withdrawals from the circular flow of income?
a) Imports, saving, taxes
b) Taxes, exports, investment
c) Government spending, saving, imports
d) Imports, taxes, government spending
Question A19
The following diagram shows the costs and revenues faced by a profit maximising monopolist.
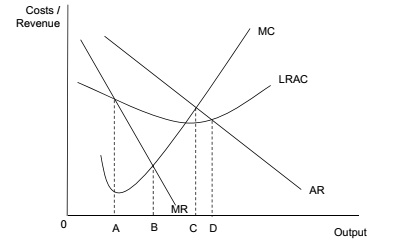
What will be the level of output in the market if the monopolist was a profit maximiser?
a) A
b) B
c) C
d) D
Question A20
The diagram below shows a firm's long run average cost curve (LRAC), with the firm producing an output of 0M.
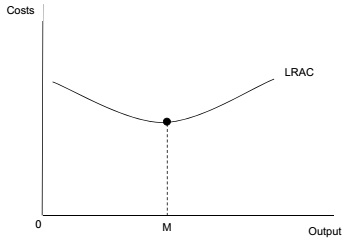
The firm's productive efficiency will improve if the
a) firm increases its level of output.
b) LRAC shifts upwards for any level of output.
c) LRAC shifts downwards for any level of output.
d) reduces its level of output.
Questions A21
IMF warns of hit to UK economic growth
The International Monetary Fund (IMF) has cut its forecast for UK economic growth next year as it warned that the global recovery remains "weak and unstable".
Although the IMF raised its prediction for UK GDP growth this year to 1.8%, the figure for 2017 was cut to 1.1%.
The IMF's latest World Economic Outlook predicts "below average" global growth this year of 3.1%, rising slightly in 2017.
Chief economist Maurice Obstfeld said: "Taken as a whole, the world economy has not moved forward. Without policy action to support economic activity over the short and longer term, below average growth will continue."
A fall in US growth this year to 1.6% however, will be offset by increases in countries including Japan, Germany and Russia and India, the IMF said.
Weak economic growth can lead to lower investment, slower productivity growth and the reduction of what the IMF calls "human capital" - which means skills and expertise.
a) Define the term "economic growth".
b) With the aid of an aggregate demand and aggregate supply diagram, analyse the effect of "slower productivity growth" on the UK.
c) Identify and analyse ONE effect on UK economy of a "fall in US growth this year to 1.6%."
d) "Weak economic growth can lead to...... the reduction of what the IMF calls "human capital".
Identify and analyse ONE economic policy a government could use to improve "human capital".
Questions A22
'Rent costs mean we keep having to move home'
Emma Percy, 34, lives in a three-bedroom house with her husband and their three children. They have moved house 10 times in the past 12 years, because of short contracts, rent increases and bad conditions of the rental properties.
"As a mother, all you want for your children is to have a roof over their heads, somewhere that's clean, warm and a bed, and somewhere they can call their own. When you can't provide that, it's really hard."
The government survey of 1,002 people asked whether they would support government regulation on such issues as regulation and maximum price controls.
|
Accommodation Survey (1,002 people)
|
|
|
Agree
|
Disagree
|
Don't Know
|
|
Should there be more
government regulation in the housing market?
|
76%
|
19%
|
5%
|
|
Do you support maximum prices for rented housing?
|
74%
|
22%
|
4%
|
But Alan Ward, chairman of the Residential Landlords Association, says that while the idea of maximum rent prices may seem "attractive", they would be a "disaster".
"All experience of them shows that they lead to landlords cutting investment or quitting the market, reducing both quality and choice for tenants. The way to reduce rents is to encourage investment and increase supply," he said.
a) Define the term "investment".
b) With the aid of a diagram, explain the effect of a maximum price on the market for rented accommodation.
c) Identify and explain ONE private benefit that might result in better quality housing.
d) Identify and analyse ONE government policy that might be used to "encourage investment and increase supply" of housing.
Section B
Part One (Micro Economics)
Question B1
a) Explain, with the use of examples, the concept of price discrimination and analyse the main causes of monopoly power.
b) Evaluate the view that monopolies should always be closely regulated by the government.
Question B2
a) Describe the concepts of social costs and benefits and with the use of examples analyse the difference between public goods and de-merit goods.
b) Evaluate the view that the most effective policy to reduce the market failure associated with the under consumption of healthy food, is to give a subsidy to producers.
Question B3
a) Describe the main characteristics of public goods and with the use of a diagram, explain the difference between consumer and producer surplus.
b) It is estimated that it would cost a government approximately $1million per megawatt to build a new renewable energy plant. Evaluate the effectiveness of cost-benefit analysis to a government when deciding whether or not to invest in new renewable energy plants.
Part Two (Macro Economics)
Question B4
a) Explain THREE factors that might cause a shift in aggregate demand and analyse the difference between Keynesian and Monetarist views on long-run aggregate supply.
b) Evaluate the view that the use of monetary policy alone is the best policy to achieve all the macroeconomic objectives of a country.
Question B5
a) Analyse the main types of unemployment in an economy and briefly outline the pattern of unemployment in the UK in recent years.
b) The Phillips Curve shows that there may be a trade-off between unemployment and inflation. To what extent do you agree that a country must always choose between unemployment or inflation?
Question B6
a) Identify and explain factors that might cause consumption, investment and saving to rise in an economy and explain the difference between absolute and relative poverty.
b) Evaluate the extent to which you agree that the best way to re- distribute income and wealth in a country is for the government to increase its expenditure on individuals with low incomes.