Reference no: EM132085392
EXERCISE - Reproduction of Statistical Graphics
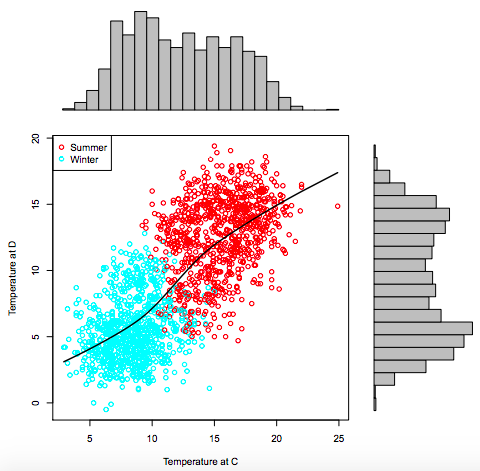
This exercise makes use of the climate data from Exercise 1. Below we present a statistical graphic based on the temperature data at locations C and D. The graphic refers to 'summer' and 'winter' periods. Because these data are from locations in the northern hemisphere, months 4-9 have been categorised as the summer period, and months 1-3 and 10-12 combined to define the winter period.
You task is to reproduce the graphic. You should submit both your reproduction of the graphic (or as close as you can get) and the R code that you used to produce it. Graphics submitted without code may receive zero credit.
This Exercise is concerned with data on 513 female athletes. Of these, 314 are 100m/200m sprinters, and 199 are 400m specialists. The following physical measurements and blood count data are available on each athlete.
|
Variable
|
Description
|
|
Ht
|
Height in cm
|
|
Wt
|
Weight in kg
|
|
LBM
|
Lean body mass, in kg
|
|
RCC
|
Red blood cell count
|
|
WCC
|
White blood cell count
|
|
Hc
|
Hematocrit
|
|
Hg
|
Hemoglobin
|
|
Ferr
|
Plasma ferritin concentration
|
|
BMI
|
Body mass index = weight/height2 (with weight in kg, height in metres)
|
|
SSF
|
Sum of skin folds
|
|
Bfat
|
Percentage body fat
|
|
Sport
|
Athlete's speciality, Sprint or 400m
|
(While these data are simulations, they are based on a real dataset with the same variables.) You can read these data into R, and store them as a data frame athlete, with the command athlete <- read.table(file
If the above command fails because you cannot access the Web address directly from R (perhaps because of problems with proxy server settings) then download the data from the 161.223 Stream site onto your computer using a web browser, then use read. table to load the data from the file on your computer.
Use exploratory data analysis techniques to address the following problems. Your answers for each part must be no longer than 100 words (excluding computer output and graphics).
1. One entry in the dataset is incorrectly recorded. Identify the data item, and suggest what the correct value should be. Explain your answer, including a summary of the methods that you used and copies of any relevant plots of the data.
2. Which three variables are best at separating data between the sprinters and 400m group? Justify your answer. Include any relevant statistical output and graphical plots.
Temperature data in parts of the UK has been recorded since 1659. This Exercise is concerned with (synthetic) maximum monthly temperature readings at four locations in the UK. The data are collected over a 140 year period. Complete records for all years are available in locations C and D. However, measurements in location A ceased approximately 80 years ago, at almost exactly the same time that temperature recordings began in location B. There are only three months over the entire period for which data are available at both A and B. The data for all other months is missing in one or other of these locations.
You can read these data into R, and store them as a data frame climate, with the command climate <- read.table(file =
If the above command fails because you cannot access the Web address directly from ft (perhaps because of problems with proxy server settings) then download the data from the 161.223 Stream site onto your computer using a web browser, then use read. table to load the data from the file on your computer.
1. The years in the dataset are numbered beginning at 1. If the first record in the dataset corresponds to January 1863, work out the precise months at which (i) the last observation was made at location A; and (ii) the first observation was made at location B.