Reference no: EM132296873
1. Market structures
Suppose that Sam sells T-shirts in a perfectly competitive T-shirt market. His output per day and his costs are as follows:
|
Output per day
|
Total Cost ($)
|
|
0
|
10
|
|
1
|
13
|
|
2
|
15
|
|
3
|
16.5
|
|
4
|
18.5
|
|
5
|
21
|
|
6
|
24
|
|
7
|
28.5
|
|
8
|
34.5
|
|
9
|
41.5
|
|
10
|
49.5
|
|
11
|
59.5
|
|
12
|
71.5
|
|
13
|
87.5
|
(a) If the current equilibrium price of a T-shirt is $6 in the market, to maximise profits how many T-shirts will Sam produce, what price he will charge and how much profit (or loss) will he make?
(b) Draw a graph to illustrate your answer. Your graph should be labelled clearly and should include Sam's demand, ATC, AVC, MC and MR curves, the price he is charging, the quantity he is producing and the area representing the profit (or loss).
(c) Suppose the equilibrium price falls to $2.50. Now how many T-shirts will Sam produce, what price will he charge and how much profit (or loss) will he make?
(d) Draw a graph to illustrate the situation in part (c) using the instructions in part (b).
(e) At an equilibrium price of $2.50, should Sam shut down the T-shirt business? Explain your answer.
2. Market structures
In Australia, drinking water is supplied by one water utility for a designated region.
(a) Explain why a water utility can be considered as a natural monopoly. Illustrate your answer using a diagram.
(b) Using a diagram, explain why it is necessary to have the price of water set by a regulatory authority.
(c) On a diagram, show the monopoly price, regulated price and efficient price for water and explain what rule might the regulatory authority use to set the price pf water?
3. Market structures

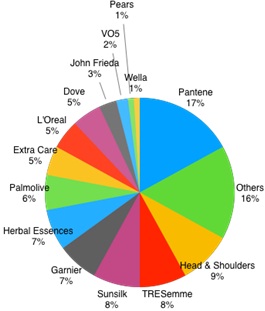
The above figure shows the national market shares of Australian shampoo and conditioner industry. What do you understand about the behaviour of firms operating under the conditions of this market? In answering this question, you should, as a minimum, discuss:
(a) The most appropriate market structure that describes this industry
(b) Explain and illustrate how short run losses or profits might arise in this market
(c) Describe the process by which profits or losses are made using graphs
(d) With examples, explain how the firms in this market engage in non-price competition.
(e) Briefly describe the limitations of this market structure.
4. Market Failure and Externalities
This question covers the topic of government intervention in the market presented in Chapter 11 of the prescribed text.
In recent years, companies have used fracking, or hydraulic fracking, in drilling for oil and natural gas that previously could not be profitably recovered. Fracking is a process that involves drilling down into the earth and injecting a high-pressure mixture of water, chemicals and sand into rock to release the gas from inside the rock. Experts are divided about whether fracking results in significant pollution, and farmers and other people in many countries, including Australia, worry that chemicals used in fracking might lead to the pollution of underground supplies of water used by farms and households.
(a) If fracking results in significant pollution, what type of externality is caused by the activity?
(b) Use a demand and supply graph to show the effect of fracking on the market for natural gas. Carefully label all curves and all equilibrium points.
(c) Use your graph in part (b) to illustrate and comment on efficient level of output and the efficient price in the market for natural gas with fracking
(d) Describe a suitable market-based government intervention that can deal with this externality. Use the graph in part (b) to illustrate and explain how the policy works