Reference no: EM131725399
Quantitative Methods in Economics, Business and Finance
Section A: Wind Power Generation
Wind power generation capacity has been growing worldwide since the early 1990s. Table 1 shows the installed wind generation capacity (measured in megawatts, MW) in the top 10 countries, as at the end of 2011.
|
Country
|
MW
|
|
China
|
62,364
|
|
United States
|
46,919
|
|
Germany
|
29,060
|
|
Spain
|
21,674
|
|
India
|
16,084
|
|
France
|
6,800
|
|
Italy
|
6,737
|
|
UK
|
6,540
|
|
Canada
|
5,265
|
|
Portugal
|
4,083
|
|
Rest of the world
|
32,143
|
|
Total
|
237,669
|
Table 1 Installed wind power generation capacity, end- 2011 (IRENA, 2012).
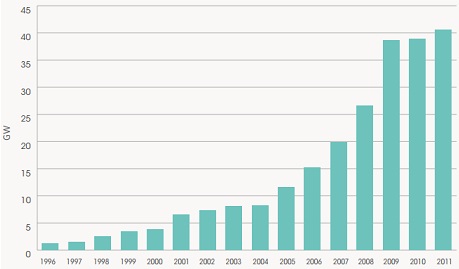
Figure 1 Global wind power additions (GW) by calendar year (IRENA, 2012).
1. At the end of 2011, what percentage of the world's installed wind generation capacity was in China?
2. Consider table 1. If you assume that other countries' capacity doesn't grow from the 2011 figures, what amount would China have to expand its capacity in order to have 40% of the world's capacity?
3. World installed wind generation capacity increased by 41 GW in 2011, and by 39 GW in 2010. By what percentage did world wind power generation increase during 2010?
4. By what percentage did world wind power generation increase, between the end of 2009 and the end of 2011?
5. Suppose the annual rate of increase in (3) continues each year, from the end of 2011. By what percentage will world wind power generation have increased by the end of 2020?
6. Under the same assumptions as (5), how long will it take for world wind power capacity to double?
7. Write a general expression for the number of years it would take for world wind power capacity to increase m times over, if it grows at the rate given in (3).
8. In reality, what has happened to worldwide wind power generation capacity since the end of 2011? Is this in line with your expectations of growth based on your answer to (5)? Explain why this may or may not be the case. Provide evidence from your own research to support your answer.
Section B: Gross Domestic Product (GDP)
In this section, we consider some issues with measuring "well-being" and "sustainability." For a much more detailed discussion of these topics, see the report by Stiglitz, Sen, and Fitoussi (2009).
A central focus of sustainability is the measurement of human "well-being," so that economic policies can be designed and evaluated against the rubric of maximizing the welfare of the people affected.
A popular way to measure people's well-being is by Gross Domestic Product (GDP), which is the final value of all goods and services in the economy. GDP includes everything produced by the economy, including investment and goods and services not consumed by individuals.
The following model for consumption is proposed:
C = aY + b (1)
where C is consumption, a is the marginal propensity to consume, b is autonomous consumption, and Y is GDP.
1. In what sense is equation 1 a model of human well-being?
2. Suppose a country was comprised of two regions, A and B. The GDP of each region is given by YA and YB, respectively. Assuming equation 1 holds, write down an expression for the whole country's GDP and its level of consumption.
3. Re-write this equation as a formula for the level of GDP in region B (denoted YB), as a function YB(C,YA) of total consumption (C) and GDP in region A (YA).
4. Treating GDP in region A as a fixed number, sketch this function with GDP in region B on the vertical axis and consumption on the horizontal axis.
5. What is the slope of the function? Is GDP in region B associated with a higher, or lower, level of well-being? Explain your answer.
6. Suppose region A was very rich, and region B was very poor. Does GDP, as a measurement of well-being, capture this inequality?
7. A loaf of bread costs about $6. A ticket to the opera costs about $150. How much does each one contribute to GDP? Do you think this adequately reflects its contribution to human well-being?
8. Suppose two identical countries possess identical, extensive forests. Country 1 decides to capitalize on this asset, by harvesting and selling the timber as paper pulp and building materials within a year, earning $100 million in the process. Country 2 decides to protect its forests, and doesn't harvest. According to the GDP measure of human wealth, which country is better off? Do you agree? Explain why or why not?
Section C: Ecological Footprint
The Ecological footprint (EF) measures how much of the regenerative capacity of the biosphere is used up by human activities. It is the sum of productive land and water area required to support the population and provide the resources it consumes, absorb its waste and provide infrastructure (Stiglitz et al., 2009, p. 244).
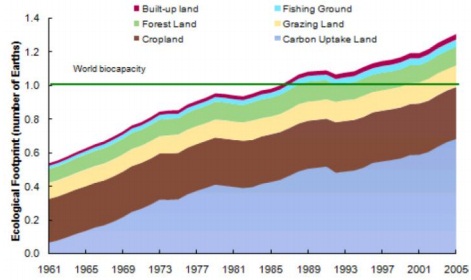
Figure 2: Humanity's ecological footprint by component 1961-2005
1. According to the EF, is the human population living at, beyond or below the Earth's natural biocapacity? For how long has this been the case? Is this sustainable?
2. If you assume that the total land use can be approximated by a linear function, what is the approximate slope of the total land use of the EF? What are the units of measurement in this function? Give the equation of, and sketch this line, with EF on the vertical axis and year on the horizontal axis.
3. If this trend of total land use continues, what will land use be in 2050?
4. Which is the largest component of land use according to the EF? At what rate is it growing?
5. Use the data presented in figure 2, along with your answers to this section, to suggest a policy to make land use sustainable.
Section D: LED Lighting
The City of Sydney is an area covering over 26km2, and is one of Australia's most important social and economic centres. As part of Sydney 2030, a study into the city's long-term sustainability, the city council committed to reducing its carbon footprint 70% over the next 20 years.
A study found that around 31% of the city's carbon emissions arise from public lighting. So, in 2011, the City of Sydney announced a project to replace its lighting systems with energy efficient LED lights. It would choose lighting systems based on both their economic and environmental value. After a consultation period, the City chose a supplier in late 2011 to replace 6,448 luminaries (lights).
Before the project, suppose that the 6,448 luminaries slated for replacement consumed 5,252,613 kWh of electricity annually. In 2010/11, the annual lighting bill was $654,476. Suppose that the new LED lights will consume considerably less power, just 2,595,743 kWh per year.
1. Bulk, unmetered power is billed on a "per KWh" basis, with no additional costs. What will the annual electricity bill be when all the lights are installed? (Assume the price of electricity is constant.) What are the private savings for the City of Sydney in the first year? (In other words, how much less will the city pay?)
2. The City of Sydney calculates carbon emissions on the assumption that each kWh of electricity causes 1.07kg of CO2 emissions. On this assumption, how many tonnes of CO2 emissions per year will the project prevent? The City of Sydney assumes a social cost of $17 per tonne of CO2. Using your own research briefly explain what is meant by the term "social cost" in this situation and calculate the social savings of this project, in the first year?
3. Suppose the City of Sydney decides to award the contract if, after including CO2 savings in revenue, the project breaks even at the end of the 12th year. What is the highest price the City should accept for this project? Ignore inflation, and assume a social discount rate of 5%.