Reference no: EM131468699
Computer Vision Homework
1. Composing Filters
Consider the following three G, E and M. G is a Gaussian smoothing kernel, E is one of the linear kernels used by the Sobel edge detector and M is a median filter. Is applying G to an image followed by E equivalent to applying E to an image followed by G? How about if M is used in place of G? In both cases, explain your answer.
Hint : Think about the properties of convolution.
2. Decomposing a Steerable Filter
In the continuous domain, a two dimensional Gaussian kernel G with standard deviation σ is given by G(x, y) = 1/(2πσ2)exp(-(x2 + y2/2σ2)). Show that convolution with G is equivalent to convolving with Gx followed by Gy, where Gx and Gy are 1-dimensional Gaussian kernels in the x and y coordinate respectively, with standard deviation σ. From a computational efficiency perspective, explain which is better, convolving with G in a single step, or the two step Gx-and-Gy approach.
3. Hough Transform Line Parameterization
Show that if you use the line equation xsinθ - ycosθ + p = 0, each image point (x, y) results in a sinusoid in (ρ, θ) Hough space. Relate the amplitude and phase of the sinusoid to the point (x, y). Does the period (or frequency) of the sinusoid vary with the image point (x, y)?
4. Impulse Response
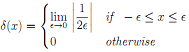
Show that Direc Delta Function's convolution preserves original function f.
-∞∫∞f(τ)(x - τ)dτ = f(x), where
5. Generalized Hough Transform
Consider the equation for a parabola in the 2-D plane, y = ax2 + b. How would you use a Hough transform to detect such parabolae given a set of points?
Hint 1: How many parameters did we use for line / circle detection?
Hint 2: Assume the center of a parabola is given as (xcenter, ycenter).
6. Hough Transform for Line Detection
In this question, you will implement some basic image processing algorithms and putting them together to build a Hough Transform based line detector. Your code will be able to find the start and end points of straight line segments in images. We have included a number of images for you to test your line detector code on. Like most vision algorithms, the Hough Transform uses a number of parameters whose optimal values are (unfortunately) data dependent (i.e. a set of parameter values that works really well on one image might not be best for another image). By running your code on the test images you will learn about what these parameters do and how changing their values effects performance.
Many of the algorithms you will implement, as part of this assignment, are functions in the MATLAB image processing toolbox. You are not allowed to use calls to functions in this assignment. You may however compare your output to the output generated by the image processing toolboxes to make sure you are on the right track.
We have included a wrapper script named houghScript.m that takes care of reading in images from a directory, making function calls to the various steps of the Hough transform (the functions that you will be implementing) and generates images showing the output and some of the intermediate steps. You are free to use and modify the script as you please, but make sure your final submission contains a version of the script that will run your code on all the test images and generate the required output images. Also, please do not miss required materials that are mentioned on each question in your writeup file.
1. Convolution
Write a function that convolves an image with a given convolution filter.
function [Iconv] = myImageFilter (Igs, S)
The function will input a grayscale image Igs and a convolution filter stored in matrix S. The function will output an image Iconv of the same size as Igs which results from convolving Igs with S. You will need to handle boundary cases on the edges of the image. For example, when you place a convolution mask on the top left corner of the image, most of the filter mask will lie outside the image. One solution is to pad a zero value at all these locations. But, for the better result, we will pad the value of nearest pixel that lies inside the image. In the interests of running time, you might want your function to treat kernel S that are just row or column vectors and not full matrices separately, but this is optional. Your code should not include MATLAB's imfilter, conv2, convn, filter2 functions or other similar pre-defined functions. You may compare your output to these functions for comparison and debugging.
2. Edge Detection
Write a function that finds edge intensity and orientation in an image.
function[Im Io Ix Iy] = myEdgeFilter (Iconv, σ)
The function will input a grayscale image Iconv and σ (scalar). σ is the standard deviation of the Gaussian smoothing kernel to be used before edge detection. The function will output Im, the edge magnitude image; Io the edge orientation image and Ix and Iy which are the edge filter responses in the x and y directions respectively.
First, use your convolution function to smooth out the image with the specified Gaussian kernel. This helps reduce noise and spurious fine edges in the image. To find the image gradient in the x direction Ix, convolve the smoothed image with the x oriented Sobel filter. Similarly, find Iy by convolving the smoothed image with the y oriented Sobel filter. After then, the edge magnitude image Im and the edge orientation image Io can be calculated from Ix and Iy.
In many cases, the high gradient magnitude region along an edge will be quite thick. For finding lines, it is most preferred to have edges that are a single pixel wide. Towards this end, make your edge filter implement non maximal suppression, that is for each pixel look at the two neighboring pixels along the gradient direction and if either of those pixels has a larger gradient magnitude then set the edge magnitude at the center pixel to zero. Please attach explanation and an example of your non maximal suppression in your writeup file.
Your submitted code cannot call on MATLAB's edge function or other similar functions. However, it is okay to use edge for comparison and debugging.
3. The Hough Transform
Write a function that applies the Hough Transform to an edge magnitude image.
function [H] = myHoughTransform (Im, Imin, rρ, rθ)
Im is the edge magnitude image, Imin (scalar) is a edge strength threshold used to ignore pixels with a low edge filter response. rρ (scalar) and rθ (scalar) are the resolution of the Hough transform accumulator along the ρ and θ axes respectively. H is the Hough transform accumulator that contains the number of 'votes' for all the possible lines passing through the image.
First, threshold the edge image. Each pixel (x; y) above the threshold is a possible point on a line and votes in the Hough transform for all the lines it could be a part of. Parameterize lines in terms of θ and ρ such that x sinθ - y cosθ + ρ = 0, where θ lies between 0 and 2π and the range of ρ is large enough to accommodate all lines that could lie in an image. The accumulator resolution needs to be selected carefully. If the resolution is set too low, the estimated line parameters might be inaccurate. If resolution is too high, run time will increase and votes for one line might get split into multiple cells in the array. In your writeup, please attach the grayscale image of Im, H, and specify your parameters used in this question.
For debugging purpose, you may use hough function. However, your final code cannot call on MATLAB's hough function or other similar functions.
4. Finding Lines
function [lρ lθ] = myHoughLines (H, rρ, rθ, n)
H is the Hough transform accumulator; rρ and rθ are the accumulator resolution parameters and n is the number of lines to return. Outputs lρ and lθ are both n x 1 vectors that contain the parameters (ρ and θ respectively) of the lines found in an image. Ideally, you would want this function to return the ρ and θ values for the n highest scoring cells in the Hough accumulator. But for every cell in the accumulator corresponding to a real line (likely to be a locally maximal value), there will probably be a number of cells in the neighborhood that also scored highly but shouldn't be selected. These non maximal neighbors can be removed using non-maximal suppression. Note that this non maximal suppression step is different to the one performed earlier. Here you will consider all neighbors of a pixel, not just the pixels lying along the gradient direction. You can either implement your own non maximal suppression code or find a suitable function on the Internet (you must acknowledge / cite the source). If you used your own implementation, then please briely describe your own method in your writeup file.
Once you have suppressed the non maximal cells in the Hough accumulator, return the line parameters corresponding to the strongest peaks in the accumulator. Then, please plot the lines to the original image and then attach the result of it on your writeup. Also, please describe why rρ and rθ are needed in here.
Your code can not call on MATLAB's houghpeaks function or other similar functions. However, we recommend you to use houghpeaks for comparison and debugging.
5. Fitting Line Segments
Implement an algorithm that prunes the detected lines into line segments that do not extend beyond the objects they belong to.
function [l] = myHoughLineSegments (lρ, lθ, Im, Imin)
Your function should output l, which is a MATLAB array of structures containing the pixel locations of the start and end points of each line segment in the image. The start location of the i th line segment should be stored as a 2 x 1 vector l(i).start and the end location as a 2 x 1 vector in l(i).end. After you compute l, please plot the lines to the original image and attach the result of it on your writeup file. (p.s. If multiple line segments can be drawn on one peak point, then please draw the longest one.)
You are allowed to use houghlines for comparison and debugging purpose. However, your cannot include MATLAB's houghlines function or other similar functions in your final implementation.
Attachment:- Assignment File.rar