Reference no: EM13298038
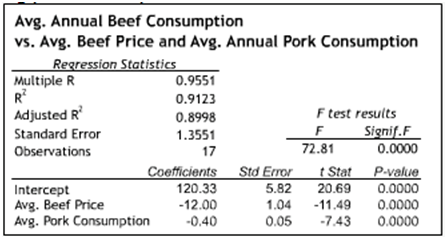
1. The regression analysis at the bottom relates average annual per capita beef consumption (in pounds) and the independent variables "annual per capita pork consumption" (in pounds) and "average annual beef price" (in dollars per pound). ??The coefficient for beef price, -12, tells us that:
1. For every $1 increase in beef price, average beef consumption decreases by 12 lbs, not controlling for pork consumption.
2. ?For every $12 drop in beef price, average beef consumption decreases by 1 lbs, not controlling for pork consumption.
3. For every $1 increase in beef price, average beef consumption decreases by 12 lbs, controlling for pork consumption, i.e. holding pork consumption constant.
4. For every $12 decrease in beef price, average beef consumption decreases by 1 lb, controlling for pork consumption, i.e. holding pork consumption constant.
2. The data in the Excel spreadsheet linked below give the seasonally adjusted value of total new car sales (in millions of dollars) in the United States, total national wage and salary disbursements (referred to here as "compensation") (in billions of dollars), and the employment level in the non-agricultural sector (in thousands) for 44 consecutive quarters. An auto industry executive wants to know how well she can predict new car sales two quarters in advance using the current quarter's compensation data. ??How many data points can she use in a regression analysis using the data provided?
1. 41.
2. 42.
3. 43.
4. ?44.
3. The Excel spreadsheet linked below contains the simple regressions of total new car sales (in millions of dollars) on each of two independent variables: "compensation" (in billions of dollars) and "employment level in the non-agricultural sector" (in thousands). ??Which of the following independent variables explains more than 90 percent of the observed variation in new car sales?
1. Compensation only.
2. Employment level only.
3. Both independent variables.
4. Neither independent variable.
4. The regression analysis below relates the value of new car sales (in millions of dollars) to compensation (in billions of dollars) and the employment level in the non-agricultural sector (in thousands) for 44 consecutive quarters. ??Which of the two independent variables is statistically significant at the 0.05 level?
1. Compensation only.
2. Employment level only.
3. ?Both independent variables.
4. Neither independent variable.
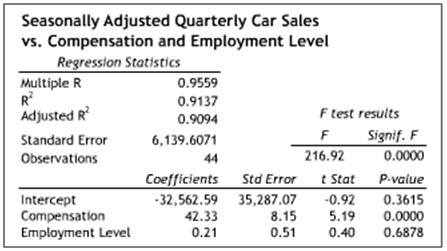
5. The regression analysis below relates the value of new car sales (in millions of dollars) and the independent variables "compensation" (in billions of dollars) and "employment level in the non-agricultural sector" (in thousands) for 44 consecutive quarters. Compare this multiple regression to the simple regressions with compensation and employment level as the respective independent variables. ??Which of the following is the likely culprit of the dramatic increase in the p-value for employment level in the multiple regression?
1. ?Multi-collinearity.
2. ?Heteroskedasticity.
3. Nonlinearity.
4. ?None of the above.
6. The regression analysis below relates the value of new car sales (in millions of dollars) and the independent variables "compensation" (in billions of dollars) and "employment level in the non-agricultural sector" (in thousands) for 44 consecutive quarters. ??The coefficient for employment level, 0.21, describes:
1. The behavior of car sales as the employments level changes, controlling for compensation.
2. The behavior of the employment level as car sales change, not controlling for compensation.
3. The behavior of car sales as the employment level changes, not controlling for compensation.
4. The behavior of the employment level as car sales change, controlling for compensation.
7. A new blood pressure treatment is being tested. The regression analysis below describes the relationship between the 41 test subjects' diastolic blood pressure and the dummy variable "medication." When a test subject is taking the new drug, the value of medication is 1, when not, the value of medication is 0. ??Which of the following can be inferred from the regression analysis?
1. The medication has no statistically significant effect (at a 0.01 significance level).
2. The use of medication accounts for around 42% of the variation in diastolic blood pressure.
3. On average, test subjects taking the medication report a diastolic blood pressure level about 5 points lower than those not taking the medication. 4. None of the above.
8. In a regression analysis, a residual plot is:
1. ?A scatter diagram that plots the values of the residuals against the values of the dependent variable.
2. A scatter diagram that plots the values of the residuals against the values of an independent variable.
3. ?A histogram that plots the frequency of certain value ranges of the residuals.
4. None of the above.
9. In a regression analysis, if a new independent variable is added and R-squared increases and adjusted R-squared decreases precipitously, what can be concluded?
1. The new independent variable improves the predictive power of the regression model.
2. The new independent variable does not improve the predictive power of the regression model.
3. ?The regression was performed incorrectly. It is impossible for R-squared to increase and adjusted R-squared decrease simultaneously.
4. The new independent variable's coefficient is not significant at the 0.01 level.
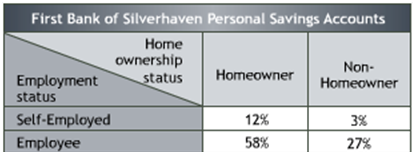
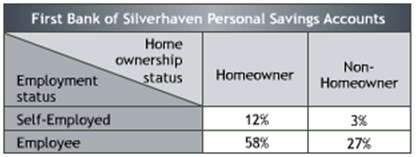
10. The table below displays data the First Bank of Silverhaven (FBS) has collected on the personal savings accounts of its job-holding customers. The table includes data on the distribution of the number of accounts held by Homeowners vs. Non-Homeowners, and by whether the customer is Self-Employed or is Employed by a firm in which he or she does not have an ownership stake. ??What is the probability that a given account-holder is self-employed?
1. 15%
2. ?12%
3. 3%
4. None of the above.
11. The table below displays data the First Bank of Silverhaven (FBS) has collected on the personal savings accounts of its job-holding customers. The table includes data on the distribution of the number of accounts held by Homeowners vs. Non-Homeowners, and by whether the customer is Self-Employed or is Employed by a firm in which he or she does not have an ownership stake. ??What is the conditional probability that an account-holder is employed by a firm in which he or she does not have an ownership stake, given that the account-holder is a homeowner?
1. ?82.9%
2. ?68.2%
3. 59.5%
4. ?None of the above.
12. The table below displays data the First Bank of Silverhaven (FBS) has collected on the personal savings accounts of its job-holding customers. The table includes data on the distribution of the number of accounts held by Homeowners vs. Non-Homeowners, and by whether the customer is Self-Employed or is Employed by a firm in which he or she does not have an ownership stake. ??Which of the following statements is true?
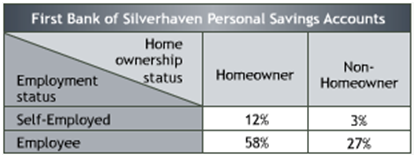
1. Home ownership and employment status are statistically dependent.
2. ?The fact that a given personal account is held by a homeowner tells us nothing about the account holder's employment status.
3. The fact that a given personal account is held by a self-employed person tells us nothing about the account-holder's home ownership status.
4. ?None of the above.
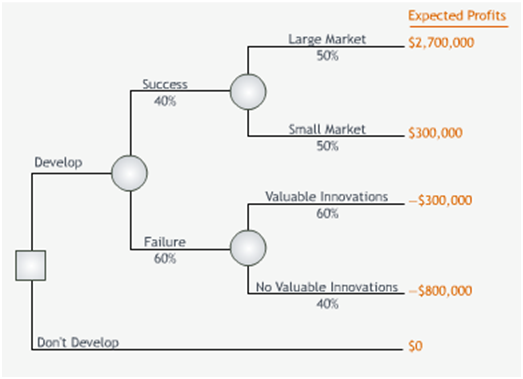
13. Electronics manufacturer SE must decide whether or not to invest in the development of a new type of battery. If the development succeeds, the market for the battery may be large or small. If it doesn't succeed, the development efforts may or may not generate minor innovations that would offset some of the battery's development costs. The tree below summarizes the decision.??What is the expected monetary value of developing the new battery?
Source
1. ?$0.3 million
2. ?-$0.5 million
3. ?$0.9 million
4. $1.5 million
14. Electronics manufacturer SE must decide whether or not to invest in the development of a new type of battery. If the development succeeds, the market for the battery may be large or small. If it doesn't succeed, the development efforts may or may not generate minor innovations that would offset some of the battery's development costs. The tree below summarizes the decision.??The EMV of developing the new battery is $300,000. Based on EMV, SE should develop the battery. If the manager chooses not to develop the battery, which of the following best describes the manager's attitude towards this decision?
1. Risk averse.
2. Risk neutral.
3. Risk seeking.
4. ?Cowardly.
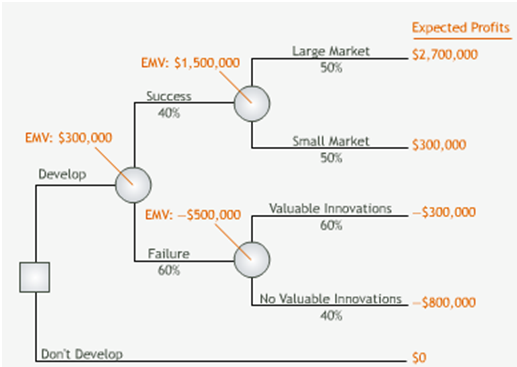
15. Electronics manufacturer SE must decide whether or not to invest in the development of a new type of battery. If the development succeeds, the market for the battery may be large or small. If it doesn't succeed, the development efforts may or may not generate minor innovations that would offset some of the battery's development costs. The tree below summarizes the decision.??The EMV of developing the new battery is $300,000. Based on EMV, SE should develop the battery. For what values of p = Prob[success] does developing the battery have a lower EMV than not developing the battery?
1. p < 25%?
2. p > 25%?
3. p < 75%?
4. ?None of the above.
16. Electronics manufacturer SE must decide whether or not to invest in the development of a new type of battery. If the development succeeds, the market for the battery may be large or small. If it doesn't succeed, the development efforts may or may not generate minor innovations that would offset some of the battery's development costs. The tree below summarizes the decision.??The EMV of developing the new battery is $300,000. Based on EMV, SE should develop the battery. Given that development is successful, for what endpoint values for a large market does developing the battery have a lower EMV than not developing the battery?
1. Less than $1.2 million.
2. ?Greater than $1.2 million.
3. Greater than $0.75 million.
4. None of the above
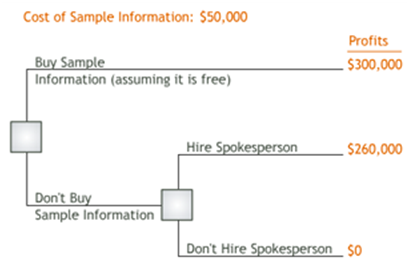
17. The manager of the Eris Shoe Company must decide whether or not to contract a controversial sports celebrity as its spokesperson. The new spokesperson's value to Eris depends heavily on consumers' perception of him. An initial decision analysis based on available data reveals that the expected monetary value of contracting the new spokesperson is $260,000. For $50,000 Eris can engage a market research firm that will help Eris learn more about how consumers might react to the celebrity. The EMV of buying this sample information (assuming it is free) for this decision is $300,000. ??The tree below summarizes Eris's decision. Based on EMV analysis, Eris's manager should:
1. Hire the research firm.
2. Not hire the research firm, but contract the new spokesperson.
3. ?Not hire the research firm and not contract the new spokesperson.
4. ?The answer cannot be determined from the information provided.