Reference no: EM133271985
Project and Analysis Questions
Question 1. Scans of internal organs using magnetic resonance imaging (MRI). These devices are often covered by subsidized health insurance programs such as Medicare. Consider the following table illustrating hypothetical quantities of individual MRI testing procedures demanded and supplied at various prices. Answer the following 3 questions
Price
|
Quantity Demanded
|
Quantity Supplied
|
|
$100
|
100,000
|
40,000
|
|
$300
|
90,000
|
60,000
|
|
$500
|
80,000
|
80,000
|
|
$700
|
70,000
|
100,000
|
|
$900
|
60,000
|
120,000
|
a. In the absence of a government-subsidized health plan, what is the equilibrium price and quantity of MRI tests?
b. Suppose that the government establishes a health plan guaranteeing that all qualified participants can purchase MRI tests at an effective price to the individual of $100 per test. How many MRI tests are now demanded? Is the result in the market a surplus or shortage?
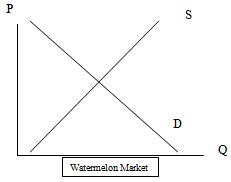
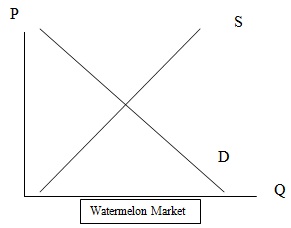
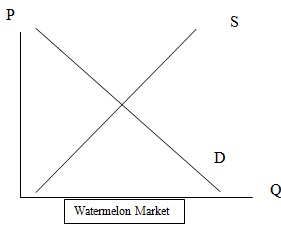
Question 2. The next 3 parts to this question give changes that have occurred in the watermelon market. For each change in a determinant given, draw in the change that would occur on the supply/demand graph for watermelons that is provided.Be sure and review what causes the curve to shift and what causes a movement along the curve as well as what determinants affect supply and what affect demand. Once you have drawn in your change, write a short explanation for each question discussing what would be the new equilibrium price and quantity levels because of this change. In other words, has equilibrium price or quantity increased, decreased or stayed the same, etc. If P or Q are indeterminate - meaning you cannot tell whether it would have changed or not - be sure and explain that. (To draw in changes on the graph, simply use the Drawing toolbar and use lines or arrows to draw in your shifts or show movement along for supply or demand.)
A. A new technology is adopted that allows production of watermelons to be increased substantially.
B. There is a substantial decrease in the price of cantaloupes. Cantaloupes are assumed to be a substitute good for watermelons.
C. Consumer's income increases (assuming watermelon is a normal good) and the number of sellers producing watermelons increases.
Question 3. Using the historical tables from the Budget of the US government, utilize the following website to determine where the US government allocates its expenditures.
Examine Table 3.1 on Outlays by Superfunction and Function. Consider what government functions have been capturing growing shares or declining shares of government spending in recent years.
Select one of the government functions and describe in a brief summary whether it has seen an increase or decrease in government spending over the past 10 to 15 years. For the function you have selected, is it related to the problem of addressing externalities, providing public goods or dealing with other market failures. Does it appear to be related to political functions instead of economic functions?
Question 4. Find an article that identifies a change in supply and/or demand. Use the article to fulfill the following instructions and questions:
A. Copy and paste the article into your homework assignment. Be sure and cite your reference for where the article came from indicating the source, author, title, date, and page for the article you have chosen.
B. Find one example in the article of any one of the following four possible shifts of supply or demand: Leftward shift of the supply curve; Rightward shift of the supply curve. Leftward shift of the demand curve; Rightward shift of the demand curve.
Write a short summary addressing the following items:
- What shift occurred in either supply or demand.
- What determinant of demand or supply was changed that caused the shift. Describe the changes in the determinant that have occurred.
- Indicate evidence in the article of whether the market is an international, national, regional, or local market
- Indicate through whom (buyer or seller) the change in the determinant of demand or supply initially affects the market to cause the shift.
PART 2
Question 1
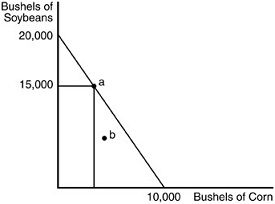
In the above figure, what is the opportunity cost of one bushel of soybeans?
options:
A) 1 bushel of corn
B) 0.5 bushels of corn
C) 2 bushels of corn
D) unable to determine
Question 2
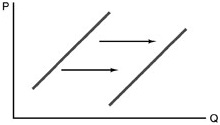
Refer to the above figure. The rightward shift of the curve indicates
options:
A) an increase in demand.
B) an increase in supply.
C) a change in quantity demanded.
D) a change in quantity supplied.
Question 3
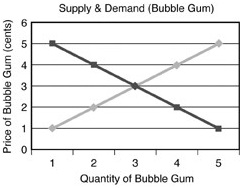
Refer to the above figure. At a price of two cents, the quantity of bubble gum demanded will be
options:
A) 3.
B) 2.
C) 4.
D) 5.
Question 4
Suppose that the demand curve for apples is downward sloping and the price per bushel increases from $6.50 to $7.50. We would then expect
options:
A) the demand for apples to decrease.
B) the quantity of apples demanded to fall.
C) the demand curve to shift toward the origin.
D) the quantity of apples demanded to increase.
Question 5
Which of the following will occur as the price of a good decreases?
options:
A) The demand curve for that good will shift to the left.
B) The demand curve for that good will shift to the right.
C) The quantity demanded for that good will increase.
D) Demand for that good will increase.
Question 6
Which of the following would cause an increase in the market supply of mountain bikes?
options:
A) a decrease in the demand for mountain bikes
B) an increase in taxes levied on mountain bike manufacturers
C) an increase in the cost of components used to assemble mountain bikes
D) an increase in the number of firms making mountain bikes
Question 7
If one day a terrible disease were to wipe out over one-half of the world's lime trees, which of the following would likely result?
options:
A) The supply curve of lime juice would shift downward and to the right.
B) The supply curve of lime juice would shift upward and to the left.
C) The demand curve for lime juice would shift to the right.
D) The demand curve for lime juice would shift to the left.
Question 8
If the price of cotton used in making blue jeans increases, which of the following will occur?
options:
A) There will be a movement along an unchanged supply curve for jeans.
B) The supply curve for jeans will shift rightward.
C) The supply curve for jeans will shift leftward.
D) There will be a rightward shift in the supply curve for jeans, followed by a movement along the supply curve.
Question 9
Suppose you are making $50,000 per year and paying $5,000 per year in income taxes. You get a $10,000 per year raise and your income taxes are now $6,500 per year. Based on this information, the income tax system is
options:
A) proportional.
B) progressive.
C) regressive.
D) bracketed.
Question 10
How is the equilibrium price determined? What happens if the price is above the equilibrium price? What happens if the price is below the equilibrium price?