Reference no: EM131565129
Problem 1
What is the difference between Gross Domestic Product and Gross National Product?
Problem 2
The book details four types of unemployment. I am of the belief that the most harmful is structural unemployment. Contrast structural unemployment to the other three forms. Whether you agree with me or not explain why structural unemployment can be more damaging than the other three.
Problem 3
Explain how inflation can have redistributive effects in the economy. Do you think the Federal Reserve over-emphasizes inflation as a policy concern? Why, or why not?
Problem 4
Thirty years ago, the price of a new Volkswagen was $5,000. (Actual price adjusted to simplify the calculation). The price of a new Volkswagen is $20,000 today. Basing your answer solely on the aforementioned prices, by what percent have prices increased over the past thirty years? (Show your work). What average annual inflation rate would have resulted in this answer? (Extra credit--show your work).
Problem 5
The example in problem 4 highlights one of the problems in computing inflation rates discussed in the text. What is it?
Internet Questions
Question 1
Go to the National Bureau of Economic Research website, "Business Cycle Expansions and Contractions." From the data given in the table, 1) describe the business cycles for the period of March 1991 to the most recent month, and 2) what conclusions can you draw about this period by comparing this cycle to previous business cycles? You may want to check the links to the two most recent Announcement Dates for further information.
Question 2
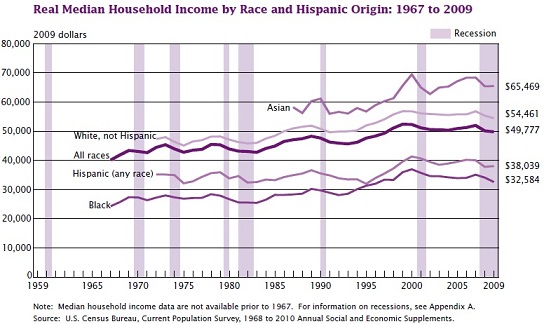
Go to this site and click on "Income Data." Report the change in Household Income for the last year to year period listed. Also view the data to see how this has been allocated by race. What do you learn from these demographics?
Income and Earnings Summary Measures by Selected Characteristics: 2008 and 2009
(Income in 2009 dollars. Households and people as of March of the following year. For information on confidentiality protection, sampling error, nonsampling error, and definitions)
|
Characteristic
|
2008
|
2009'
|
Percentage change
in real median income
|
|
Number (thousands)
|
Median income
(dollars)
|
Number (thousands)
|
Median income
(dollars)
|
Estimate
|
90 percent confidence interval2 (±)
|
|
Estimate
|
90 percent confidence interval2 (±)
|
Estimate
|
90 percent confidence interval2 (±)
|
|
HOUSEHOLDS
|
|
|
|
|
|
|
|
|
|
All households ......................
|
117,181
|
50,112
|
225
|
117,538
|
49,777
|
350
|
-0.7
|
0.68
|
|
Type of Household
|
|
|
|
|
|
|
|
|
|
Family households................................
|
78,850
|
62,383
|
421
|
78,833
|
61,265
|
311
|
*-1.8
|
0.68
|
|
Married-couple...................................
|
59,118
|
72,733
|
538
|
58,410
|
71,830
|
410
|
*-1.2
|
0.75
|
|
Female householder, no husband present................................................
|
14,480
|
32,947
|
618
|
14,843
|
32,597
|
541
|
-1.1
|
2.00
|
|
Male householder, no wife present .
|
5,252
|
48,999
|
1,088
|
5,580
|
48,084
|
1,156
|
-1.9
|
2.59
|
|
Nonfamily households..........................
|
38,331
|
29,964
|
305
|
38,705
|
30,444
|
281
|
*1.6
|
1.13
|
|
Female householder .........................
|
20,637
|
24,919
|
382
|
20,442
|
25,269
|
345
|
1.4
|
1.68
|
|
Male householder .............................
|
17,694
|
35,869
|
434
|
18,263
|
36,611
|
456
|
*2.1
|
1.43
|
|
Races and Hispanic Origin of Householder
|
|
|
|
|
|
|
|
|
|
White.......................................................
|
95,297
|
52,113
|
249
|
95,489
|
51,861
|
253
|
-0.5
|
0.55
|
|
White, not Hispanic ...........................
|
82,884
|
55,319
|
369
|
83,158
|
54,461
|
459
|
*-1.6
|
0.86
|
|
Black ......................................................
|
14,595
|
34,088
|
723
|
14,730
|
32,584
|
648
|
*-4.4
|
2.24
|
|
Asian.......................................................
|
4,573
|
65,388
|
2,271
|
4,687
|
65,469
|
2,084
|
0.1
|
3.81
|
|
Hispanic (any race) ..............................
|
13,425
|
37,769
|
796
|
13,298
|
38,039
|
826
|
0.7
|
2.04
|

Question 3
The Bureau of Economic Analysis is the National Income Accounting arm of the Department of Commerce. It has the responsibility to calculate the national income accounts (including Gross Domestic Product) and to provide this information.
This NIPA Tables page will provide you with all the data needed to complete the following assignment. Scroll down and click on Table 1.1.5. Gross Domestic Product. Next, select 1997 for the first year and 2009 for the last year. Select the Annual button, then click Update. For the years 1997 and 2009, I want you to provide the following data:
- Gross domestic product (GDP)
- Personal consumption expenditures
- Gross private domestic investment
- Net exports of goods and services
- Government consumption expenditures and gross investment
Calculate the percentage change between the first and last years for each of the above. What trends do you see?
Textbook in use: Essentials of Economics 8th edition by Bradley R. Schiller