Reference no: EM133204664
Assignment: Water Usage Worksheet
Analyzing Water Usage
'Being green' is commendable, but I hope that people don't take too much pride and self-adoration because they shut off the water when they brushed their teeth. The truth of the matter is, conservation alone will do little to save our planet. Bigger steps need to be taken; and they need to be taken soon.
~ Naveen Jain
According to the United States Geological Survey (USGS), the government agency that oversees United States water supplies, the United States has abundant freshwater resources. However, many existing sources of groundwater and surface water, such as wells, lakes, and reservoirs, are in danger of being overused, and drought is a problem in some areas. The economic and environmental health of the country-and of the entire planet-depends, in part, on maintaining a balance between water demand and water supply.
In this exercise we will look into how has water usage changed in the United States since 1950? The primary objectives of the lab are to:
1. Analyze changing trends in water usage over a 50-year period.
2. Determine which categories use the most water per day.
3. Discuss conservation methods that might decrease water use.
Materials: Calculator
Procedure:
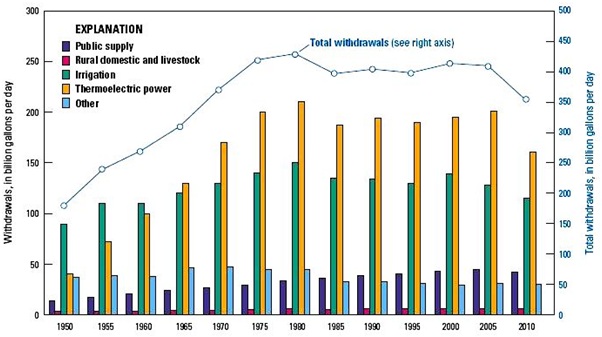
I. Study the bar graph, based on data from the USGS. Look for patterns in water usage. Do certain categories consistently use more water than others? Have some categories increased their water use more quickly than others?
II. Create a data table based on the graph. Place the eleven time periods across the top of the table. List the five categories on the left side of the table. In the rows, write the total amount of water used per day by each category for the years listed.
III. Calculate the total amount of water used per day by all categories for each year. Add this information to the data table.

Task
I. Approximately how many billions of liters of water were used per day in the United States in 1990?
II. How does this amount compare to total water usage in 1950?
III. Which category showed the greatest increase over the course of the 50 years shown in the graph?
IV. What might account for the increase?
V. Which category showed a decrease in water use over the course of 50 years? What might account for the decrease?
VI. When did water usage peak in the United States for most categories? Which categories continued to show an increase? Make a hypothesis for the reasons behind the increase.
VII. Which two categories consistently account for most water usage in the United States? How much water did these categories use in 1980?
VIII. Describe how water might be used for each category in the graph.
IX. The 1990 population of the United States was about 252 million. Use the amount listed in the "Public supply" category for 1990 to calculate the average amount of water each United States citizen used daily.
X. Think of all the ways that you use water each day. Describe at least three things that you could do as an individual to decrease your daily water use. Identify two things that government or industry could do to decrease water use.