Reference no: EM132393998
BSBITU402 Develop and use complex spreadsheets
ASSESSMENT
This assessment has been designed to address the gaps of the unit BSBITU402 for learners of AIHC. This assessment has three parts or tasks and you will need to submit two documents one via soft copy email and this document in hard copy as your assessment evidence. An overview of each task is below.
Task 1
Create two (2) graphs from given data using help from online.
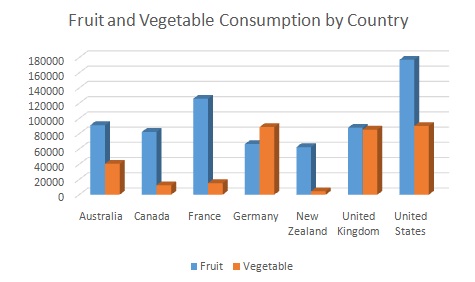
The assessor will provide you with the initial data, take this information to create a pivot table and graph similar to the following (please note figures below have been changed):
|
Row Labels
|
Sum of Amount
|
|
Fruit
|
693069
|
|
Australia
|
91221
|
|
Canada
|
82338
|
|
France
|
125931
|
|
Germany
|
66430
|
|
New Zealand
|
62392
|
|
United Kingdom
|
87786
|
|
United States
|
176971
|
|
Vegetables
|
336665
|
|
Australia
|
40492
|
|
Canada
|
12407
|
|
France
|
15125
|
|
Germany
|
88738
|
|
New Zealand
|
4390
|
|
United Kingdom
|
85351
|
|
United States
|
90162
|
|
Grand Total
|
1029734
|
Reference the websites that you used to help you create the pivot tables.
Task 2
Filter, sort and reorganise the information to create three 3D column graphs (standard, stacked and 100% stacked) of consumption by month of different fruits and vegetables in Australia.
Your file must be saved, emailed to your trainer with the subject header BSBITU Gap Asst (Surname, First Name).
Once completed you will need to answer the questions provided.
Task 3
In a group, discuss and compare graphs based on format, design and creation process.
Together in a group you will review the graphs you have developed and discuss the following questions, during the discussion you will need to take notes.
• Discuss some of the advanced functions, including how they may be applicable for different businesses
• Compare the different charts, how do different formats affect the readability of the data? Which of the charts do you think are the most effective in relation to conveying the datas purpose?
• How could you improve upon your own efficiency if you had to repeat a similar task like this?
The gap for this unit requires you to be able to complete the following:
Skills-
• Use manuals, user documentation and online help to overcome problems with spreadsheet design and production
• Create graphs with labels and titles from numerical data contained in a spreadsheet file
• Uses listening and questioning skills to clarify requirements
• Recognises and follows explicit and implicit protocols and meets expectations associated with own role
• resolve issues by referring to user documentation and online help
• evaluate tasks to improve efficiency
• communicate with relevant personnel
Knowledge-
• explain advanced functions of spreadsheet software applications
• describe impact of formatting and design on presentation and readability of data
• explain organisational requirements for work periods and breaks
All components of this assessment must be evidenced satisfactorily in order for the Learner to be deemed competent.
Resources you will need to complete assessment:
• One copy of the spreadsheet via soft copy
• A copy of this record of evidence
• A computer or laptop with Microsoft office and access to the internet