Reference no: EM13949200
1. Medical records show strong positive correlations between the number of days a patient stays in the hospital, the total cost of the visit and the number of different illnesses the patient has (a) Does this mean more efficient management practices that reduce the length of hospital stays could reduce the number of different illnesses patients have? Explain (b) Does this mean such practices could reduce the cost of the hospital visits? Explain.
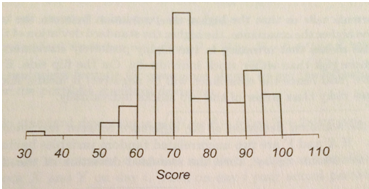
2. in evaluating employee performance and determining salary raises, a company uses a large number of subjective and objective criteria gathered from numerous evaluators that are then combined together to give each employee an overall score between 0 and 100. The raise an employee gets depends on the score as follows: people scoring under 41 points get no raise , people scoring between 41-50 get a 1% raise, 51-60: 2% raise, 61-70: 3% raise ,71-80: 4%, 81-90,6% 91-100: 8% Below is a histogram of the overall scores and scatter plot(with the correlation coefficient displayed above it) showing the score for each employee versus the length of time between when the evaluation was finished and when the employees learned the results from their managers (a) Rumors at the company suggest that the longer it takes to hear the results, the lower the score because managers may be postponing a difficult discussion with the employee about poor performance. Do the data support this concern? (B) Top management is concerned about rumors that scores were unfairly bumped up a few points for many employees to help them get raises that weren't justified by their performance. Is there any evidence of this here?
Exercise WK3_X1
A manager of a large chain of nationwide sporting goods stores would like to know which of the following factors has the strongest link to sales: Age (median age of customer base in years), HS (percentage of customer base with a high school diploma), College (percentage of customer base with a high school diploma), Growth (annual population growth rate of customer base over the past 10 years), and Income (Median family income of customer base in dollars). Looking at the file WK3_X1.xls what do you conclude? The data stored in the file WK3_X1.xls are the monthly sales totals from a random sample of 38 stores in the franchise. All stores in the franchise and thus within the sample, are approximately the same size and carry the same merchandise. The county, or in some cases the counties in which the store draws the majority of its customers is referred to here as the customer base. For each of the 38 stores, demographic information about the customer base is provided. The data are real, but the name of the franchise is not used, at the request of the company.
Exercise WK3_X2
Management of a soft-drink bottling company wants to develop a method for allocating delivery costs to customers. Although one cost clearly relates to travel time within a particular route, another cost variable reflects the time required to unload the cases of soft drink at the delivery point. A sample of 20 deliveries within a territory was selected. The delivery times (in minutes) and the number of cases delivered were recorded in the file WK3_X2.xls. An analyst computes the delivery time per case delivered and averages these to get 0.33 minutes. Using this he gives an estimated delivery time of 50 minutes for 150 cases to be delivered. Is this a reasonable delivery time? Explain why or why not. Looking at the data in the file, can you give a better estimate? Make sure that you justify your estimate.
3. Sales figures for each sales associate in a large company are calculated for the current year and last year. Last year average sales per associate was 500,000 and the average for this year is about the same. True or false and explain briefly: the regression effect says that the number of associates who sold over $1 million in the current year should be somewhat less than the number who sold over $1 million last year.
4. The Price earnings ratio (PE ratio) for a stock is a commonly used measure of how over-priced or underpriced a company's stock is. There are a number of different statistics about a company that are available that might explain why this ratio differs for different companies. One of these statistics is a measure of future growth. To examine the relationship between P Es and the measure of future growth (FG), you run a simple regression and get the equation
PE=3+.9FG.
The R2 for this model is 18% and the standard error is 5. Another model was run using a measure of dividends (D) to explain the PE. This gives the equation
PE =1.6 + 13.2D
(a) Give a managerial interpretation for the coefficients 3 and .9
(B) A particular company has a value of 15 on the measure of future growth its P E ratio is 4.5 what would you conclude about this company's PE? Briefly explain
(c) Since 13.2 is greater than. 9 can you conclude the PE ratio has a stronger relationship to dividends than future growth? If not, what would you need to know to conclude which variable has a stronger relationship to the P E ratio? Briefly explain.
Attachment:- WK3_X2.xls
Attachment:- WK3_X1.xls