Generate linear regression to predict the test score outcome

Assignment Help Data Structure & Algorithms
Reference no: EM132736821

QUESTION 1

You run the linear regression using one variable using SPSS statistics, which provides the following output:

Model            Coefficient        Std, Error
1 - Constant       80                  580
SystolicBP          1.82               .137

What is the linear regression equation for this model?
1.y = 80* SystolicBP + 1.82
2.y= 580 * SystolicBP + 80
3. y = 1.82 * SystolicBP + 80
4.y= .137*SystolicBP + 80

QUESTION 2

If University GPA' = (0.675) (High School GPA) + 1.097  is the linear regression for the university GPA, what is the interpretation for the coeficient 1.097.

1. Because a value of 0 for the (High School GPA) is not applicable in this model the y-interceptor 1.097 has not a valid meaning in this case.
2.1.097 is the average error the model would make when (High School GPA)=O
3. For a student with (High School GPA)=0 we can expect a value of 1.097 GPA when he(r) joins the university.
4. The y-interceptor of 1.097 does not have any special meaning.

QUESTION 3
Among the possible lines that can be used as estimation model which line do we pick?
1.There is only one line that approximates the observed values and therefore optimum by definition.
2. We pick the line that minimize the sum of squared error function.
3. We pick the line that minimize the quantity:
∑(y'-y)
With y' the estimated value of the regression line.
4.We pick the line that maximizes SSE.

QUESTION 4

What is the hypothesis testing we conduct on the linear regression model in one variable as the one below?
y=β0+βx+ ∈
01.
H0: β0 =0 No relationship between x and y.
Ha: β0 ≠0 Linear relationship between x and y.
02.
H0 β0≠ 0 Linear relationship between x and y.
Ha: β0 = 0 No relationship between x and y.
3.
H0: β0 = 0 No relationship between x and y.
Ha: β0 ≠ 0 Linear relationship between x and y.

QUESTION 5
You generate the scattered plot of TestScore and HoursStudied as shown in the picture:

143_figure.jpg

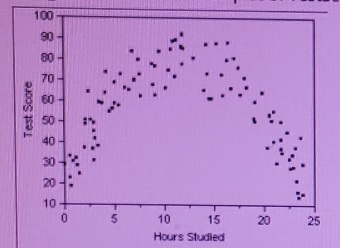
You decide to go ahead and generate a linear regression to predict the test score outcome.
1. You can create a linear regression model only for students that study up to 8 hours, it would be a mistake to assume the same
relationship for values >8.
2. No you cannot build a linear regression model since the relationship between the two variables is clearly non-linear.
3. You can build the linear regression model: it does not really matter the type of relationship shown by the scattered plot.
4. You can build the linear regression, knowing the model will have a large estimation error. However, since you know the curviinear
relationship you can adjust for the error.

QUESTION 6

What is the test statistics used to verify the fit for the independent variable 3 in the linear regression

Y=β0x + ∈
1. The test statistics is t=β/Sb with sb the standard error of the coefficient β.
2. The test statistics is t=β0/Sb with sly the standard error of the coefficient β0.
3.The test statistics SSR/SST with SSR equal to the Sum of Square Regression and SST equal to the Total' Sum of Square
4. The test statistics S=√MSE.

Reference no: EM132736821

Questions Cloud

What steps must be taken to get iso certification : What steps must be taken to get ISO certification? How is the documentation written?
Management ethics final assingment : Explain if the company has a global ethics policy, do the infractions go against policy?
Find what amount will income before income taxes be : Errors were not corrected and that no errors occurred in 2016. By what amount will 2017 income before income taxes be overstated or understated?
Globally harmonized system of classification and labeling : Find an example of a new Globally Harmonized System of Classification and Labeling (GHS) label for a specific chemical and the corresponding
Generate linear regression to predict the test score outcome : What is the test statistics used to verify the fit for the independent variable 3 in the linear regression and what is the interpretation for the coeficient
What the net cash provided by financing activities : What the net cash provided by financing activities during 2017 is? Purchase of land by issuing bonds $1,550,000. Proceeds from sale of land 925,000
Explain why the salesmen were so low in morale : Explain why the salesmen were so low in morale. Provide your recommendations for Bodine Electronics in light of any CLASSICAL motivation theories.
How the supervisor undermines the corporate culture : a. Based on the case above discuss THREE (3) ways how the supervisor undermines the corporate culture.
Find what is total amount of expense relating to the item : Cheffing's interim income statement for the three months ended March 31, 2017, what is the total amount of expense relating to this item that should be reported

Reviews

len2736821

12/19/2020 3:49:17 AM

there are 6 multiple choice questions with selected answers that I got wrong i would like to know the correct answer to the 6 multiple choice questions in the file i have uploaded to you folks

Write a Review

Data Structure & Algorithms Questions & Answers

  Various search trees and numerous sorting techniques

This week we were introduced to various search trees and numerous sorting techniques. Taking into consideration what you have learned this week, discuss how you can help Bob with his problem.

  Show the binary tree threaded as described

In each of begin with this tree and show the BST that results after the operation or sequence of operations is performed on this tree.

  Advanced systems analysis and designtasks 1 - produce a

advanced systems analysis and designtasks 1 - produce a system specification indicating functional and non-functional

  How hash functions are used in different computing areas

Research and explain in your own words what and how hash functions are used in these different computing areas and describe

  Find the breadth first number of a vertex

It may seem clear to some people that the breadth first number of a vertex is the number of vertices previously added to the tree.

  Create an avl tree using data entered as a sequential set

Create an AVL tree using the following data entered as a sequential set. Show the balance factors in the resulting tree:

  Diameter bounded minimum spanning tree of graph by prim-s

Modify Prim's or Kruskal's algorithm to determine diameter bounded minimum spanning tree of complete graph. A diameter bounded minimum spanning tree is spanning tree.

  Analyze an algorithm that finds the smallest numbers

CS 6033: Design and Analysis of Algorithms - New York University - Design and analyze an algorithm that finds both the smallest and the second smallest numbers

  B+-tree

For the B+-tree where M=3 and L=5 shown below, show how an insert of value 80 is handled.

  What are limitations of arrays

What is an array? What are limitations of arrays? Give an example to show the usefulness of arrays - Write a program to implement a stack which contains

  What problems come up in verifying this function

How many recursive calls are made by the following initial calls?

  Design and build a prototype data warehouse

Design and build a prototype data warehouse using the data on Spend over £500 in the Department of Energy and Climate Change for the financial year 2012-2013 (April 2012 to March 2013 inclusive).

Free Assignment Quote

Assured A++ Grade

Get guaranteed satisfaction & time on delivery in every assignment order you paid with us! We ensure premium quality solution document along with free turntin report!

All rights reserved! Copyrights ©2019-2020 ExpertsMind IT Educational Pvt Ltd