Generate a piece of data of acceleration measurements

Assignment Help Simulation in MATLAB
Reference no: EM131970287

Biomedical Signal Processing Lab Assignment -

Stage 1 - Filter Design by Using Matlab/Labview

Matlab exercise task 1: For a non-periodic signal f(t), calculate FT:

362_figure.png

1. Please draw f(t):

When N = 8 and select the time range T = 2, f(n) should be {2, 1, 0, 0, 0, 0, 0, 1} (why). Then, for the DFT F(k), Δf = 1/T = 0.5 Hz, and Δt = T/N = 0.25s.

2. Please draw DFT F(k).

3. Please draw the spectrum.

4. Try different N = 2m and T.

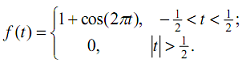
Matlab exercise task 2: For a periodic signal f(t) = 1+cos(2πt), calculate F.S.

Task for Stage 1:

a. Generate a piece of data of acceleration measurements by using TA/IMU, which contains walking in the speed range from 1km/hour to 7km/hour. Or download a piece of physiological data from PhysioNet or any other online databases. If you build your own accelerometer, you will get extra marks for stage 1.

b. Use DFT or FFT analysis to show the spectrum of the data, and give a detailed explanation about the obtained spectrum.

c. Based on the obtained spectrum, define the performance requirements of the filter to be designed.

d. Design both IIR filter and FIR filter by using Matlab.

e. Analysis the spectrum of the filtered data by using FFT.

f. Compare the spectrum of the original and filtered data to show the performance of the designed FIR and IIR filters.

g. If the required performance are not satisfied, return to Step d. Until the required performance has been achieved.

h. Implement the designed FIR and IIR filter by Labview and record the real-time performance of the filters and demonstrate to lab tutor.

i. Find the advantages and disadvantages of FIR and IIR filters by comparing the performance of the designed FIR and IIR filters.

j. Write a detailed report a which includes all the above steps plus a conclusion.

Stage 2 - STFA, WT, and DWT

Tasks for Stage 2:

a. Generate a piece of data by using TA or IMU, which contains siting down, walking in the speed range from 1km/hour to 7km/hour, and running. Or download a piece of data from PhysioNet or any other online databases.

b. Use STFT/ WT analysis to show the transformed data, and give a detailed explanation about the obtained results.

c. Analyze data by using CWT and mark the data with activity types (e.g., walking or running).

d. Design a DWT filter by using Matlab.

e. Implement the designed DWT filter in Labview and record the real-time performance of the filters and demonstrate to lab tutor.

f. Write a detailed report which includes all the above steps plus a conclusion.

Attachment:- Assignment Files.rar

Reference no: EM131970287

Questions Cloud

What are the types of expenses : Examples should include direct costs items, indirect costs items, as well as variable costing. What are at least 5 types of expenses that are associated.
What amount of unrealized gain or loss would it report : Assume the following data with respect to the price of the call options and the gold inventory purchase. Date Spot Price for October Delivery
Expected-average payoff in game : If your chosen number is a hit, you win $3. Otherwise, you lose that $1. What is your expected/average payoff in this game?
What is the significance of the delisting of 21st century : Why is it that leveraged buy outs and management buy outs are best suited for low risk businesses with stable cashflows?
Generate a piece of data of acceleration measurements : Biomedical Signal Processing Lab Assignment. Stage 1 - Filter Design by Using Matlab. Generate a piece of data of acceleration measurements by using TA/IMU
What is leytons dso : What is Leyton's DSO, what would it be if all customers paid on time, and how much capital woul dbe released if Leyton could take action that led to on time pay
Why people are attracted to urban areas in developing world : Examine the main reasons why people are attracted to urban areas in the developing world, and select the key issues that make this rural to urban migration.
Probability that the sample proportion : According to Harris poll, chocolate is the favorite ice cream flavor for 27% of Americans. If a sample of 100 Americans is taken, what is the probability
How much will a similar house cost after five years : If house values are appreciating at the average annual rate of inflation of say 5%, how much will a similar house cost after 5 years?

Reviews

Write a Review

Simulation in MATLAB Questions & Answers

  Calculate the stress intensity factor

Use the three-parameter zone finite element method or the boundary collocation method to calculate the stress intensity factor K, at the crack tip for the plate

  Build a simulation using newtons laws of motion

Build a new and different simulation of your own using Newtons laws of motion and Show the code and describe how it works

  Write the specification of load mover

Write the specification of LOAD MOVER detailed of the whole design and precise for automatic control section and divide the design into various modules and Is the kernel required if yes which one?

  Design the automatic control section using statecharts

Aim of this project is to design an embedded system which can move loads from one place to another. The system can be operated manually, automatically and wirelessly.

  Need an expert who can model a drill in simulink

Need an expert who can model a drill in Simulink. Working model of a drill needing for an improvment to behave more realistically as a drill to drill through plastic block.

  Project is on load frequency control using fpid

Project is on load frequency control using FPID tuned using GA and PSO algorithm and the system is a two area system.

  Number of packets received with time

Let x be the number of packets received with time -

  Build a matlab based graphical user interface

Build a Matlab based graphical user interface (GUI) that operates in conjunction with a base Matlab/ Simulink simulation program. Any base simulation is considered acceptable.

  Build a matlab based graphical user interface

Build a Matlab based graphical user interface (GUI) that operates in conjunction with a base Matlab/ Simulink simulation program. Any base simulation is considered acceptable.

  Simulate the standardised sum of independent

Simulate the standardised sum of independent and identically distributed variates - Fit a linear regression model as in Q5, and plot your estimates for β0 and β1 as N increases, together with a line indicating their true values. Supply your code.

  Plot the original periodic square wave

Plot the original periodic square wave on the same graph. Comment on the difference between the original periodic square wave and its truncated Fourier series presentation.

  Use matlab to plot the function

Plot the original periodic square wave on the same graph. Comment on the difference between the original periodic square wave and its truncated Fourier series presentation.

Free Assignment Quote

Assured A++ Grade

Get guaranteed satisfaction & time on delivery in every assignment order you paid with us! We ensure premium quality solution document along with free turntin report!

All rights reserved! Copyrights ©2019-2020 ExpertsMind IT Educational Pvt Ltd