Reference no: EM132795586
Multivariate Statistical Analysis Assignment
Question 1. Consider centering our multivariate data, i.e. x*j = xj - x¯, for j = 1, 2, . . . , n. The first principal component is obtained by maximising the sample variance of y1 = uT1 x∗j. Show that this is equivalent to minimising the residual sum of squares, where the jth residual is defined as
||x*j - u1Tx*j/u1Tu1).u1||
Question 2. Varimax is a commonly used oblique rotation technique. When applied to factor analysis, does it affect the values of the communitalities? Please justify your answer.
Question 3. A study was conducted to investigate the factors and predictors leading to the bankruptcy of firms. As part of the study, a factor analysis was conducted and the model with m = 3 factors was chosen. The sample correlation matrix of the eight variables under consideration was given below.
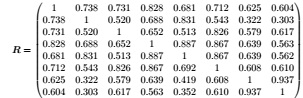
Estimate of the factor loadings was obtained using the principal component method. The three (estimated) factor loadings obtained were

and their proportion of total variance explained were 0.287, 0.341, and 0.280 respectively.
(a) Find the specific variances and communalities.
(b)Calculate the residual matrix, given by R - LˆLˆT - Ψ.
(c) Is having m = 3 factors appropriate? Justify your answer.
(d) In the context of this study, a factor loading less than 40% is considered small. The variables can be categorized into 3 groups:
{[x1, x2, x3], [x4, x5, x6], [x7, x8]}
Comment on any findings you observed. For example, does any of the groups contribute significantly to one or more factors?
Question 4. A survey was conducted on n = 70 randomly chosen people to study the association between owning certain assets and happiness indices. The variables were total price of cars owned (x1), total price of TV owned (x2), price of most valuable asset (apart from cars and houses) (x3), happiness score (x4), and satisfaction score (x5).
The sample correlation matrix obtained was given by
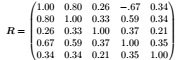
(a) Find the sample canonical correlations.
(b) Perform a statistical test to determine whether the two groups of variables ( x1, x2, x3 and x4, x5 ) are uncorrelated.
(c) Using standardized variables, construct the canonical variates corresponding to the "significant" canonical correlation(s) and interpret them.
(d) Do the assets variables provide much information about the happiness variables (i.e. happiness score and satisfaction score)?
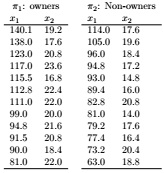
Question 5. Consider two groups in a city:
π1 : ride-on-mower owners
π2 : owners without ride-on mowers
In order to identify the best sales prospects for an intensive sales campaign, a ride-own mower manufacturer is interested in categorising families as proprioceptive owners or non-owners on the basis of income (x1) and land size (x2). A random sample of n1 = 12 current owners and n2 = 12 current non-owners were surveyed. The data is given in the following table.
(a) Develop a linear classification function for this data.
(b) Using the function developed in part (a), construct a ‘confusion matrix' by classifying the given observations in the data.
(c) Find the apparent error rate.
(d) State any assumptions you make to justify the use of the method in parts (a) and (b).
Bonus question
The following question is optional and may be attempted for bonus marks.
Question 6. Derive an EM algorithm for calculating the maximum likelihood estimate of the parameters of the isotropic Gaussian mixture model, where the ith component of the mixture model has distribution of the form Np(µi, σ2iI) with µi and σi2 being unknown.