Reference no: EM132847928
Task 1 Q1: In this question, you are required to use GNU Octave. Sinusoidal (sine) waves are commonly used in wireless communication to represent the signal that needs to be transmitted over the wireless channel, e.g., in various modulation techniques. A sinusoidal wave can be mathematically represented as y = Asin(2*Π* f * t) where A, Π, f, t represent amplitude, a constant pi, frequency (Hz), and time (seconds), respectively. Using GNU Octave, plot two sine waves (y1, y2, y3 ) on the same plot (hint: use subplot command) with A = 1, Π = 3.14, f1 = 3Hz, f2 = 2f1, f3 = 3f1, (value of t goes from zero to thirty). Label x and y axis of each plot with 'Time (sec)' and 'Amplitude' respectively. Give the title of the plot as 'Name = your name, SID = your student ID'.
Deliverable: You are required to submit your executable Octave code in a text file and figure showing three plots. Submit only one file including code and figure.
Task 1 Q2: Free Space Propagation and Path Loss
In a free space wireless propagation environment, transmit power between a transmitter and receiver usually decreases due to free space path loss denoted as Lf (dB) and can be expressed as a function of distance d between the transmitter and receiver. Your task is to calculate and plot the path loss Lf (dB) for a distance d = 0 to 30 km and carrier frequency fc = 100, 500 and 1000 MHz. Assuming that the transmit power Pt is 40 watts, you can calculate and plot the received power Pr as a function of distance d (as given above) for the carrier frequencies given above. You can assume transmit and receive antennas gains are the same, i.e. Gt = Gr = 0 dB
Deliverable: You are required to plot path loss Lf (dB) as a function of distance for each carrier frequency, so you will have three curves in the plot. You also need to plot received power Pr as a function of distance d for each carrier frequency, so you will have three curves of the received power. You need to submit your executable GNU Octave code along with the plots in a single Word file.
Task 2: Research Project
1. You are working as Network Design Engineer with local service provider and your manager has asked you to propose the design for the below cellular architecture shown in Figure 1. In your design provide the following information with reasons; Base station sites locations, Antenna specification (such as antenna shape, height, gains etc), mention the type of the area considering the cell size (such as suburban, metropolitan, rural etc) and justify you design. Note that the numbers within each cell are representing the traffic density in Erlang.
2. Looking at the figure below, justify the design of this cellular network with appropriate reasoning?
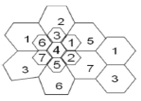
Figure 1: Cellular Architecture
|
Find the probability of rolling a 3 on the die
: -A STAT 200 professor took a sample of 10 test scores from a class of 30 students. The 10 scores are shown in the table below:
|
|
What extent does the failure of the equal rights amendment
: What extent does the failure of the Equal Rights Amendment to be ratified, but the signing of Title IX into law, signal about the changing role
|
|
Confidence interval for the true population mean
: Assume the population standard deviation is 6.3 ounces. Based on this, construct a 90% confidence interval for the true population mean watermelon weight.
|
|
What was the series of events that brought britain
: What was the series of events that brought Britain and the colonies to the brink of war by 1774? To what extent were experiences product of poor leadership
|
|
Free space propagation and path loss
: Free Space Propagation and Path Loss - Design of this cellular network with appropriate reasoning - propose the design for the below cellular architecture
|
|
How contact with europeans disrupted native american culture
: How contact with Europeans disrupted Native American cultures in terms of population, trade, land ownership, diplomacy, warfare, and religion.
|
|
What percent of students score between 80 and 92
: State end-of-tests tend to follow a normal distribution. In 2008, the mean test score for 8th graders was 76.5 with a standard deviation of 5.
|
|
Discuss major problem that represents dark side of period
: Pick and discuss a group that was left out of these "good times" or pick and discuss a major problem that represents a "dark side" of this period.
|
|
What is the probability of getting a red marble
: 1) What is the probability of getting a red marble? 2) What is the probability that it was drawn from bag 2, given that the marble was blue?
|