Fourier transform and biosignal analysis

Assignment Help MATLAB Programming
Reference no: EM1390393

The Fourier transform is a powerful tool for converting time-series data into its frequency components for the purpose of signal analysis and processing.

Background

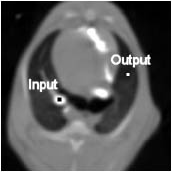
In this assignment, you are given a file called "PBF.txt" which is actual pulmonary blood flow data acquired by computed tomography (CT) imaging of porcine animal models. The data was obtained by a 1-second bolus injection of non-iodinated contrast agent into the right ventricle (RV). Due to mixing in the RV, the bolus is "low-pass filtered" and results in a unimodal input function, x(t), measured in the pulmonary artery (PA) using CT imaging.
861_Fourier transform.png

This input function traverses from the PA through various arterial pathways and eventually reaches the lung parenchyma (i.e. microvascular beds within the lung). The extent to which contrast flows to the microvascular beds can also be measured using CT techniques.

Assignment

Download the "PBF.txt" file. In the file, you will find four columns:

(1) time data (unit: seconds),

(2) input function, x(t), measured at the pulmonary artery (unit: Hounsfield Unit (HU)),

(3) output function, y(t), measured in the lung parenchyma (unit: Hounsfield Unit (HU)),

(4) transfer function, h(t), which describes the system which modifies the input from the PA and produces the output seen at the lung parenchyma.

Using Matlab:

  • Plot x(t), y(t), and h(t), each vs. time.
  • In the time domain, descriptively analyze the how the x(t) differs from y(t).
  • Perform a Fourier Transform (Matlab command, fft(x)) of x(t), and y(t). Plot the magnitude (i.e. "abs") of the FFTs of the input (x(t)) and output (y(t)). (Note: Using the FFT function, you will obtain an output that has both real and imaginary components).
  • Determine how many frequencies are needed to adequately (respectively within +1% and +5% error) represent the original time series data (analyze for both x(t) and y(t)).

Hint: (1) You will need to use the IFFT function to perform the "inverse FFT" to go from the frequency domain back to the time domain)

(2) Error= sum(abs(x(t))-abs(x_new(t)))/sum(abs(x(t))) x and x_new are the original time history and new one generated by IFFT

  • Plot the original vs. the "truncated" waveforms that you generate for each.
  • Comment/discuss your observations.
  • Using the transfer function, h(t), convolve your new input function with the transfer function and compare the output with the original output (y(t)) and your new output function. (Hint: Use the CONV command in Matlab. Using CONV, the length of the new data will be twice as long as the original vector. Only plot the first half).

Download:- PBF.txt

Verified Expert

Reference no: EM1390393

Questions Cloud

Types of graphs in math education : An important idea in data interpretation is choosing which graph to use under which circumstances. Describe the benefits of different graphs for different sets of data:
Three-digit personal identification number : Assuming that the first digit cannot be a zero, compute the number of possible outcomes when the digits can be repeated.
Expected winnings for a person buying one ticket : A raffle offers a first prize of $1000 2 second prizes of $300 and 20 third prizes of $10 each. If 15000 tickets are sold at 75 cents each, find the expected winnings (IN CENTS) for a person buying one ticket?
Conversion of data to pie chart : Of the estimated natural gas reserves in North America, 4.59 *10^9 m ^3 are in United States. 2.66*10^9 m^3 are in Canada, and 1.99*10^9 m^3 are in Mexico.
Fourier transform and biosignal analysis : Fourier Transform and Biosignal Analysis - series data into its frequency components for the purpose of signal analysis and processing.
How mutant vasopressin receptor bind vasopressin : Discuss how can a mutant vasopressin receptor bind vasopressin normally without exerting its normal physiological effect?
Computerized mrp systems automatically optimize material : Computerized MRP systems automatically optimize material flow through a production system
Find percent change in the area of mold growth : Steve is in the midst of his Microbe experiment. He is increasing mold on a piece of peach. After five days in the baggie, the mold covers 88 square millimeters of the peach surface.
Effect on profits of the requirement that the number of unit : The effect on profits of the requirement that the number of units of the BodyPlus 200 produces must be at least 25% of the total production

Reviews

Write a Review

MATLAB Programming Questions & Answers

  Finite difference method

Use the finite difference method to calculate the temperature at the point specified since it is easier.

  Determine the necessary shell temperature

In a shell-and-tube heat exchanger, one fluid passes through a central tube while another fluid flows through an outer shell in the opposite direction. The purpose is to heat the fluid passing through the central tube.

  Find the integral of a function at an arbitrary location

Write a Matlab function to perform numerical integration of a set of evenly spaced data points using the trapezoidal rule

  Compute the speed of single-stage planetary gear train

Write a MATLAB function [speed] = planetary (N, emesh, first, last, arm) that computes the speed of a given link in a single-stage planetary gear train.

  Calculate and plot the error in the numerical derivative

Write a program to calculate and plot the error in the numerical estimate of the derivative.

  Create the graph using matlab functions

Create the graph, which contains a piecewise function where a line exists in the first interval, a parabola in the second interval, and the sine function in the third interval.

  Develop a simulation program

Develop a simulation program

  Create a vector in matlab

Create a three dimensional diagram of function.

  Open a named pipe and to read data from the pipe

Open a named pipe and to read data from the pipe in matlab

  Write the commands that will create the matrix

Write the commands that will create the matrix.

  Lagrange interpolating polynomial of degree

Lagrange interpolating polynomial of degree

Free Assignment Quote

Assured A++ Grade

Get guaranteed satisfaction & time on delivery in every assignment order you paid with us! We ensure premium quality solution document along with free turntin report!

All rights reserved! Copyrights ©2019-2020 ExpertsMind IT Educational Pvt Ltd