Reference no: EM13938878
PROBLEM 9–4
Using Prospective Analysis to Value Securities
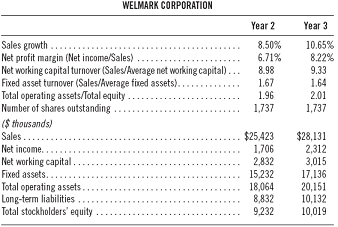
Following are financial statement information for Welmark Corporation as of Year 2 and Year 3.
Page 534Required:
Using the residual income model, prepare a valuation of the common stock of Welmark Corporation as of Year 3 under the following assumptions:
a. Forecast horizon of five years.
b. Sales growth of 10.65% per year over the forecast horizon and 3.5% thereafter.
c. All financial ratios remain at Year 3 levels.
d. Cost of equity capital is 12.5%.
EXERCISE 9–1
Forecasting Income and Income Components
Quaker Oats Company
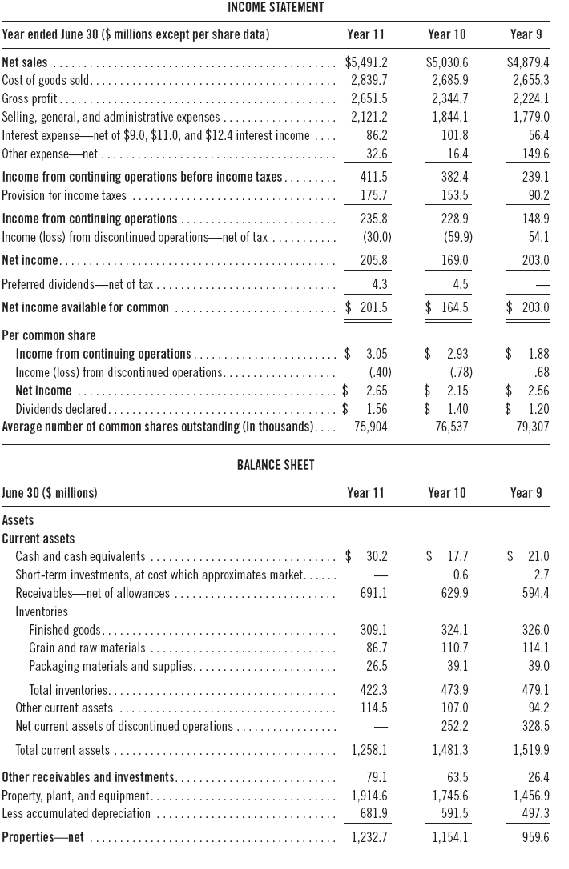
Refer to the financial statements of Quaker Oats Company in Problem 9–6. Prepare a forecasted income statement for Year 12 using the following assumptions ($ millions):
1. Revenues are forecast to equal $6,000.
2. Cost of sales forecast uses the average percent relation between cost of sales and sales for the three-year period ending June 30, Year 11.
3. Selling, general, and administrative expenses are expected to increase by the same percent increase occurring from Year 10 to Year 11.
4. Other expenses are predicted to be 8% higher than in Year 11.
5. A $2 million loss (net of taxes) is expected from disposal of net assets from discontinued operations.
6. Interest expense, net of interest capitalized and interest income, is expected to increase by 6% due to increased financial needs.
7. The effective tax rate is equal to that of Year 11.
CHECK
Forecast NI, $140.1 mil.
Quaker Oats Company
Refer to the following financial statements of Quaker Oats Company.
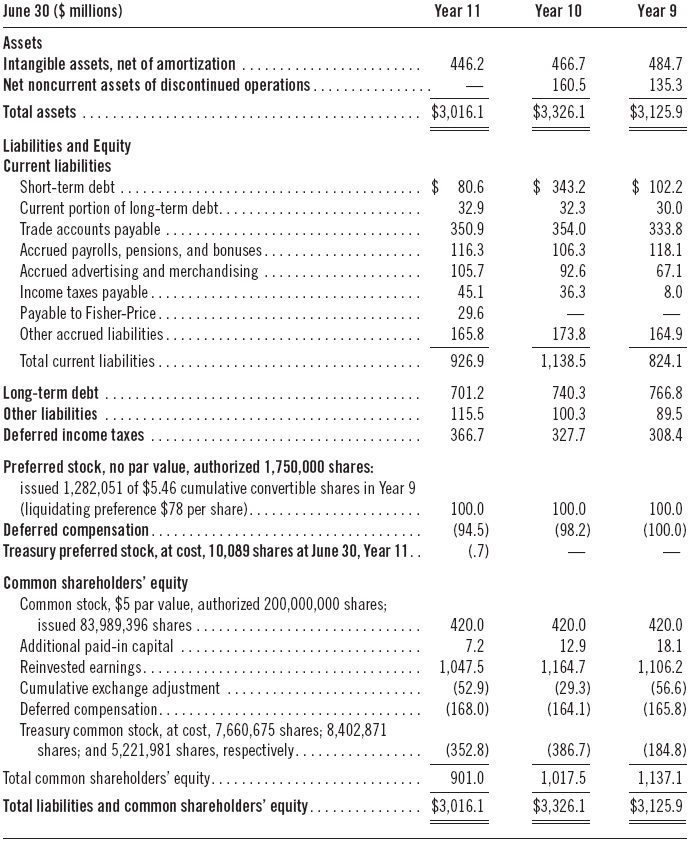
Page 537Additional assumptions for your forecasting task include:
1. Income from continuing operations in Year 12 is expected to equal the average percentage of income from continuing operations to sales for the three-year period ending June 30, Year 11.
2. The depreciation and amortization forecast for Year 12 uses the average percentage relation of depreciation and amortization to income from continuing operations for the period Year 9 through Year 11. The average is computed at 82.33%.
3. Forecasts of deferred income taxes (noncurrent portion) and other items in Year 12 reflect the past three years’ relation of deferred taxes (noncurrent) and other items to total income from continuing operations of 22.9%.
4. Provisions for restructuring charges are predicted to be zero for Year 12.
5. Days’ sales in receivables is expected to be 42 for Year 12.
6. Days’ sales in inventory of 55 and a ratio of cost of sales to sales of 0.51 are forecasted for Year 12.
7. Changes in other current assets are predicted to be equal to the average increase/decrease over the period Year 9 through Year 11 of $25.6.
8. Days’ purchases in accounts payable of 45 is forecasted for Year 12, and purchases are expected to increase in Year 12 by 12% over Year 11 purchases of $2,807.20.
9. Change in other current liabilities is predicted to be equal to the average increase/decrease over the period Year 9 through Year 11 of $24.5.
10. There are no expected discontinued operations.
11. Decreases in short-term debt are predicted at $40 million each year.
12. No cash inflows are expected from issuance of debt for spin-off and no cash effects from purchases or issuances of common and preferred stock.
13. Predicted year-end cash needs are equal to a level measured by the ratio of cash to revenues prevailing in Year 11.
14. Additions to long-term debt in Year 12 are equal to the amount needed to meet the desired year-end cash balance.