Reference no: EM13372393
For the following demand function.
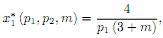
for values of m > 1.
a. Obtain Income elasticity of demand. Plot the Engel curve for p1 = 1.
b. Is this a normal good?
c. Assuming that preferences are monotonic (then the individual always spends all its income), use the budget constraint to solve for x�2* (p1, p2, m).
d. The consumer faces the following prices and income level.
prices p1 = 1, p2 = 1.5 and income m = 5.
Calculate the quantity demanded for goods 1 and 2 at these prices and this income level.
e. Obtain income and substitution effects with Slutsky compensation when the price of good 1 drops to pi = 0.5
Part-2
Assume preferences can be represented by the following utility function.
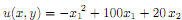
a. Is the utility function monotonic? Justify.
b. Set up the consumerís utility maximization problem for prices p1, p2 and income m (the general case)
c. Solve the problem. You will obtain demand functions x�1* (p1, p2, m) and x�2* (p1, p2, m) in terms of the parameters (p1, p2, m).
d. Graph the demand function for good 1 when the price of good 2 is p2 = 2 and income is m = 200.
e. Obtain the change in consumer surplus when the price of good 1 goes from p1 = 2 to p1 = 4.
f. Again, assuming the price of good 1 increases to pi = 4. Find the Compensating and the Equivalent Variations
g. For the same price increase, obtain the income and substitution effects on good 1, both with Slutsky and Hicks compensations.