Fit a least-squares regression line and compute t

Assignment Help Basic Statistics
Reference no: EM131716160

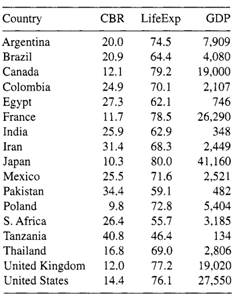
Question: Plot the scatter diagram using the crude birth rate as the Y variable and GDP per capita as the X variable from the data given in Problem.

(a) Fit a least-squares regression line and compute T.

(b) Try a transformation on X and recompute r. Did it increase, and if so, why?

Problem: The following table contains data from 17 countries. These countries are a systematic sample from twice this number of countries that had a population > 30 million people in 1998 and had complete data. The data were taken from the US. Bureau of the Census, Statistical Abstracts of the United States; 1998, 118th ed., Washington, DC. It consists of the crude birth rate (CBR) or the total number of births divided by the total population in 1998, life expectancy (LifeExp) from birth in years for the overall population, and gross domestic product (GDP) per capita for 1995. The GDP has been adjusted and then converted to U.S. dollars.
781_CBR.png

(a) State which model the data in the table follows.

(b) Plot the scatter diagram when X = life expectancy and Y = crude birth rate and fit a regression line.

(c) Does the data appear to follow a straight line?

(d) If life expectancy increased by 10 years, what do you expect to happen to the crude birth rate?

(e) Test that Ho : β = 0. If you test that p = 0, will you get the same P value?

Reference no: EM131716160

Questions Cloud

Describes problems exporters have with letters of credit : Describe two Incoterms®2010 rules of your choice and explain which of them is more exporter-friendly and why.
What you see as the companys goals : What will that involve? As you consider their HR policies, how will you ensure they are effectively aligned with what you see as the company's goals?
How much money would be paid on the partially secured debt : Ataway Company severe financial difficulties and is considering filing a bankruptcy petition. In a liquidation, how much money be paid on partially secured debt
Discuss your thoughts and opinions on the records message : Discuss your thought and opinion on record message. Is increase on business reliance on technology positive or negative given decreasing workplace productivity?
Fit a least-squares regression line and compute t : Plot the scatter diagram using the crude birth rate as the Y variable and GDP per capita as the X variable from the data given in Problem.
Discuss personal strength : Name one method for improvement for each of these, and discuss why it is important for you to work on these skills if you want to present your findings
Strategies for overcoming barriers : EBP change proposal from continuing to obtain the same desired results 6 months to a year from now, and your strategies for overcoming these barriers
Discuss whereby people concerned are aware of rules : Explicit culture: is whereby people concerned are aware of rules, customs and regulations within the culture and they learnt them consciously like norms
Compute the estimated gross profit : Using the percentage-of-completion method, compute the estimated gross profit that would be recognized during each year of the construction period

Reviews

Write a Review

Basic Statistics Questions & Answers

  Appropriate for addressing question

The true mean hours of sleep a night of college students in the United States is 6.2 hours. Suppose you want to use a hypothesis test to determine whether the mean hours of sleep a night of BYU-Idaho students is higher than the national mean. Whic..

  Find out probability values from discrete distribution

A consumer organization estimates that over a 1-year period 17 percent of cars will require to be repaired once, 7 percent will need repairs twice, and 4 percent will require three or more repairs. What is the probability that a car chosen at rand..

  Test whether the mean rate is less-using p value approach

Test whether the mean rate is less than 6%. Use P-value approach.

  What is the probability of a randomly selected credit card

assume credit card balances are normally distributed with a mean of 2870 and a standard deviation of 900 - assume these

  Probability of a random sample of male siberian tigers

Find the probability that a random sample of 4 male Siberian tigers will have a sample mean weight more than 450 lb.

  Find the probability that alarm will function

Let X equal the number of cells activating the alarm when the temperature reaches 100_Fahrenheit. Find the probability that the alarm will function when the temperature reaches 100_F.

  A pair of dice is rolled the sum of the faces on top is

question a pair of dice is rolled. the sum of the faces on top is observed. what are the expectation variance and

  Describe the measures of central tendency

According to the Bureau of Labor Statistics, the average annual salary of a worker in Detroit, Michigan, is $35,748.

  Find the probability of getting at least under-performing

The probability worker to be is hardworking is 0.55 and 0.45 under-performing. Find the probability of getting at least an under-performing in an office with 4 workers.

  Assume a normal distribution draw a well-labeled curve for

assume a normal distribution. draw a well-labeled curve for each part.a. find the z-score that gives a left area

  What is the domain of given random variable

Define a random variable to be X = number selected - nearest integer . -  What is the domain of this random variable?

  Comparing the observed and the predicted values

Refer to Exercise 9.10. After the least squares line has been obtained, the table below (which is similar to Table 9.4) can be used for (1) comparing the observed and the predicted values of y, and (2) computing SSE.

Free Assignment Quote

Assured A++ Grade

Get guaranteed satisfaction & time on delivery in every assignment order you paid with us! We ensure premium quality solution document along with free turntin report!

All rights reserved! Copyrights ©2019-2020 ExpertsMind IT Educational Pvt Ltd