Reference no: EM131009093
1. Consider the bounded 3-D region R bounded by the planes z = x, z = -x, and the curved surface z = 1 - y2
a. This is a rather cryptic way to describe the region. Which side of these planes and curved surface are we talking about? There are 8 possibilities, unless you're told which way the inequalities run
i. Show that the region z ≤ x, z ≤ -x, z ≤ 1 - y2 includes the half-line (x,y,z) = t(0, 0, -1), t ≥ 0. Does this mean that R has to be one of the other seven?
ii. Show that for every point (x,y,z) in the region, R1 = {(x,y,z) : z ≥ x, z ≥ -x, z ≤ 1 - y2,}. We have z ≤ 1, z ≥ 0, -1 ≤ y ≤ 1, x ≤ 1, and x ≥ -1. Hint: for starters, z ≤ 1 because otherwise z cannot be ≤ 1 - y2 . Next, how could z be less than 0, when z must be at least as the greater of x and -x? And so it goes
b. To eliminate the remaining six regions by logical analysis would be rather a pain. Here's a picture.
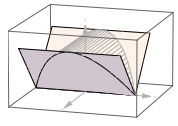
Using the picture of R = R1, or using the inequalities defining R1, find the volume of R, and find z.
(2) Set up an integral for the area of the curved bounding surface of the R = R1 from problem 1. You'll have to figure out what the shadow, in the x-y plane, of that curved bounding surface is. It looks a little bit like a lemon.
|
Summarize the central value for sales
: a) Make a suitable display of the sales from the data provided. b) Summarize the central value for sales for this week with a median and mean. Why do they differ?
|
|
Appropriate graphical displays and summary statistics
: The U.S. Department of Transportation collects data on the amount of gasoline sold in each state and the District of Columbia. The following data show the per capita (gallons used per person) consumption in the year 2005. Write a report on the gas..
|
|
What could happen if enough risks are not fully understood
: What could happen if enough risks are not fully understood before beginning the Perform Qualitative Risk Analysis process
|
|
Mean or the median to summarize the center
: McGwire, again. Look once more at data of home runs hit by Mark McGwire during his 16-year career as seen in Exercise 34. a) Would you use the mean or the median to summarize the center of this distribution? Why?
|
|
Find the volume of r and find plane z
: To eliminate the remaining six regions by logical analysis would be rather a pain. Using the picture of R = R1, or using the inequalities defining R1, find the volume of R, and find z.
|
|
Do you think it would be skewed to the left
: If a histogram for speeds of vehicles through intersection A were drawn, do you think it would be skewed to the left, skewed to the right, or approximately symmetric? Explain.
|
|
Describe the techniques of reducing project duration
: Present the project plan / network created, and make sure that critical path is properly depicted. Describe the techniques of reducing project duration, and describe if any such techniques are used for your project
|
|
Find the range and iqr for these data
: Pizza prices, part 2. The weekly prices of one brand of frozen pizza over a three-year period in Chicago are provided in the data file. Use the price data to answer the following questions.
|
|
Find the range and iqr for data
: The weekly prices of one brand of frozen pizza over a three-year period in Dallas are provided in the data file. Use the price data to answer the following questions.
|