Reference no: EM131738999
Project-
Problem 1 -
Single-Sideband AM: In discrete time, amplitude modulation with a sinusoidal carrier is given by y[n] = x[n]cos(ωcn), where the message signal is assumed to have bandwidth less than 2ωc. The modulated signal has a FT with duplicate copies of X(ω) centered at ω ± ωc. This duplication is undesirable as it can lead to a decrease in the number of users who can transmit simultaneously over a communications channel. Single-sideband (SSB) modulation is a feasible solution which is equivalent to filtering y[n] prior to transmission with an ideal lowpass filter of cutoff frequency ωc. The filtered signal occupies the same frequency bandwidth as x[n] and x[n] can be recovered. In this exercise, you will consider an alternative method for constructing SSB signals using the Hilbert transform. The frequency response of an ideal Hilbert transform is given by:
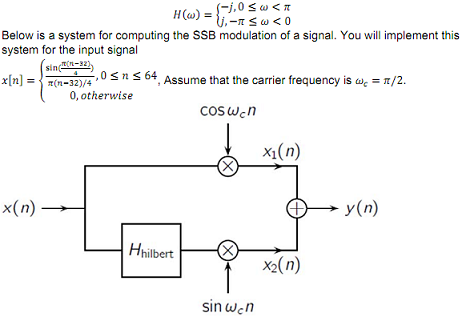
a. Store the nonzero elements of x[n] in the vector x. Use fft(x, 256) to obtain 256 samples of the DTFT of x[n]. Plot the magnitude of the Fourier transform and label the frequency axis. Determine the approximate frequency bandwidth occupied by the signal x[n].
b. Store in x1 the nonzero samples of x[n]cos(ωcn). Use fft to compute 256 samples of the DTFT of x1[n] = x[n]cos(ωcn). Plot the magnitude of the Fourier transform and describe its relation to the FT of x[n] plotted in (a).
c. Based on the frequency response of the Hilbert transform given above, what symmetry does the impulse response h[n] possess?
d. Note that the impulse response of the ideal Hilbert transform in both non-causal and has infinite length. In this problem, we will consider a shifted and windowed version of the impulse response of the ideal Hilbert transform. The windowing provides an impulse response with finite length and the shifting is required to make a causal approximation. Consider the system with frequency response Hα(ω) = e-jαωH(ω). Sketch the magnitude and phase of this system by hand.
e. Derive the impulse response hα[n] of the system. If α is an integer, about which value of n is hα[n] symmetric?
f. For α=20, store the values of hα[n] on the interval 0 ≤ n ≤ 40 in the vector h. Use stem to plot the samples of h versus n.
g. Use conv(h, x) to compute the Hilbert transform of the signal x[n] on the interval 0 ≤ n ≤ 64. Store this signal in the vector xh. Note that you will need to select the vector xh from the output of conv(h, x) as this output has length greater than 64. Remember that the filter stored in h is a delayed version of the Hilbert transform, and that conv computes values of the convolution hα[n] * x[n] outside the interval 0 ≤ n ≤ 64 by assuming that x[n] is zero outside the interval 0 ≤ n ≤ 64. The point of symmetry in the vector xh should be the same as the point of symmetry in the vector x.
h. Use fft(xh, 256) to compute the samples of the DTFT of the signal stored in xh. Plot the magnitude of this FT.
i. Store in x2 the values of x2[n] = xh[n]sin(ωcn) on the interval 0 ≤ n ≤ 64, where xh contains xh[n] on this interval. Use fft to compute 256 samples of the DTFT of the signal stored in x2. Plot the magnitude of the FT and describe its relation to the FT magnitude plotted in (h).
j. You have now synthesized the two signals necessary to form the modulated signal y[n], which is the output of the system above. Store in y the values of this signal on the interval 0 ≤ n ≤ 64. Use fft(y, 256) to compute the samples of the DTFT of the signal stored in y. Plot the magnitude of this DTFT and label the frequency axis. This plot should illustrate that y contains the SSB modulation of x[n]. Over what frequency range is the DTFT essentially zero? Does the signal stored in y require approximately the same bandwidth as x[n]?
k. You can demodulate the signal y[n] to recover x[n]. The first step is to modulate the SSB signal with a sinusoid. What is the correct frequency of this sinusoid? The second step is to lowpass filter the modulated signal. For the lowpass filter, you can use the windowed sinc function. What is the approximate range of cutoff frequencies that you can use to recover x[n]? After selecting an appropriate cutoff frequency and normalization, use this lowpass filter to recover x[n]. Compare the recovered signal with the original signal. The difference should be very small.
Problem 2 -
2. In this exercise, we will explore the effect of discrete-time all-pass systems on discrete-time signals. Consider the two systems defined by the following difference equations:
System1: y[n] = x[n-3]
System2: y[n] - (3/4)y[n-1] = -(3/4)x[n]+x[n-1]
a. Find the transfer function for both systems analytically. Sketch the magnitude responses to verify that they are all-pass systems.
b. Define coefficient vectors a1 and b1 for System 1 and use freqz to generate magnitude and phase responses. Define coefficient vectors a2 and b2 for System 2 and use freqz to generate magnitude and phase responses. Is the phase of H2(ω) the same as the phase of H1(ω)? When the inputs to the both systems are the same, would you expect the outputs to be the same?
c. Define x to be the input signal, x[n] = (3/4)nu[n] for 0 ≤ n ≤ 50. Plot x using stem.
d. Let y1[n] and y2[n] be the outputs of Systems 1 and 2. Find these outputs analytically. Compute y1 and y2 using the filter command in MATLAB. Plot the outputs. Are they the same? Which of the outputs looks more like the input signal?
e. Use fft to compute X(ω), Y1(ω), Y2(ω). Plot the magnitudes of the three Fourier transforms and compare them.
f. Consider the systems obtained by cascading 2, 3, and 4 copies of System 2. Define vectors y22,y23,y24 to represent the outputs of these systems computed using filter. Plot x,y2, and each of three outputs computed. How would you describe the effect of each all-pass system?
g. The all-pass changes the appearance of the signal without changing its energy. Compute the energy of the input signal x, and all of the output signals in part f). How do they compare?
Attachment:- Assignment Files.rar