Reference no: EM132563436
Homework - Hypothesis Testing With Two Samples
Question 1:
You are conducting a study to determine if there is a significant difference between average adult weight of males and females (in pounds). Calculate the test-statistic, t with the following sample data.
n1 = 35 , x‾1 = 186, s1 = 9
n2 40 , x‾2 = 181, s2 = 7
Question 2:
You wish to test the following claim (Ha ) at a significance level of α = 0.10 .
Ho: μ1 = μ2
Ha: μ1 > μ2
You obtain the following two samples of data.
Sample #1
|
43
|
59.1
|
59.7
|
58.5
|
|
72.9
|
37.4
|
62.5
|
117
|
|
69.8
|
56.1
|
96.8
|
64.1
|
|
63
|
111.4
|
70.8
|
53.5
|
|
68.3
|
54.2
|
85.1
|
33.4
|
|
52
|
30.7
|
47.2
|
92.4
|
|
81.9
|
68.8
|
69.8
|
105.2
|
|
85.1
|
62.5
|
82.5
|
107.9
|
|
21.6
|
39
|
99.6
|
73.4
|
|
33.4
|
60.8
|
88.1
|
117
|
|
51.3
|
70.8
|
80.6
|
107.9
|
|
63.6
|
81.2
|
30.7
|
40.5
|
|
105.2
|
52.8
|
93.4
|
71.9
|
|
67.8
|
80.1
|
|
|
Sample #2
|
58.9
|
63.6
|
59.2
|
66.8
|
|
57.8
|
69.3
|
70.7
|
64.9
|
|
62.2
|
55.7
|
55.7
|
63.7
|
|
74.3
|
68.8
|
56.9
|
58
|
|
76.7
|
53
|
53
|
55.7
|
|
63.6
|
63.7
|
66.3
|
51.5
|
|
73.6
|
69
|
71.7
|
73.6
|
|
66.5
|
70.7
|
60.1
|
67.4
|
|
64.9
|
62.6
|
69
|
61.1
|
|
56.9
|
61.3
|
71.3
|
65.5
|
|
74.3
|
69.7
|
57.2
|
62.2
|
|
62.2
|
68.5
|
58
|
66.9
|
|
68.8
|
62.6
|
66
|
65.7
|
|
64
|
62.9
|
69.7
|
|
What is the test statistic for this sample? (Report answer accurate to three decimal places.) test statistic =
What is the p-value for this sample? For this calculation, use the degrees of freedom reported from the technology you are using. (Report answer accurate to four decimal places.)
p-value =
The p-value is...
less than (or equal to) α
greater than α
This test statistic leads to a decision to...
reject the null
accept the null
fail to reject the null
As such, the final conclusion is that...
There is sufficient evidence to warrant rejection of the claim that the first population mean is greater than the second population mean.
There is not sufficient evidence to warrant rejection of the claim that the first population mean is greater than the second population mean.
The sample data support the claim that the first population mean is greater than the second population mean.
There is not sufficient sample evidence to support the claim that the first population mean is greater than the second population mean.
Question 3:
You are testing the claim that the proportion of men who own cats is larger than the proportion of women who own cats.
You sample 50 men, and 10% own cats.
You sample 90 women, and 35% own cats.
Find the proportion of the pooled samples, (pc), as a decimal, rounded to two decimal places.
Question 4:
You wish to test the following claim (Ha) at a significance level of a = 0.10 .
H0:P1 = P2
Ha:P1 > P2
You obtain 374 successes in a sample of size n1 = 457 from the first population. You obtain 351 successes in a sample of size n2 = 458 from the second population. For this test, you should NOT use the continuity correction, and you should use the normal distribution as an approximation for the binomial distribution.
What is the test statistic for this sample? (Report answer accurate to three decimal places.) test statistic
What is the p-value for this sample? (Report answer accurate to four decimal places.) p--value =
The p-value is...
less than (or equal to) α
greater than α
This test statistic leads to a decision to... 0 reject the null
accept the null
fail to reject the null
As such, the final conclusion is that...
There is sufficient evidence to warrant rejection of the claim that the first population proportion is greater than the second population proportion.
There is not sufficient evidence to warrant rejection of the claim that the first population proportion is greater than the second population proportion.
The sample data support the claim that the first population proportion is greater than the second population proportion.
There is not sufficient sample evidence to support the claim that the first population proportion is greater than the second population proportion.
Question 5:
In each of the following scenarios, determine if the data are paired.
(a) We would like to know if Intel's stock and Southwest Airlines' stock have similar rates of return. To ?find out, we take a random sample of 50 days, and record Intel's and Southwest's stock on those same days.
paired
not paired
(b) We randomly sample 50 items from Target stores and note the price for each. Then we visit Walmart and collect the price for each of those same 50 items.
paired
not paired
(c) A school board would like to determine whether there is a difference in average SAT scores for students at one high school versus another high school in the district. To check, they take a simple random sample of 100 students from each high school.
not paired
paired
Question 6:
You are performing a left-tailed matched-pairs test with 29 pairs of data. If a = .10 , find the critical value, to two decimal places.
Question 7:
A survey of 33 people was conducted to compare their self-reported height to their actual height. The difference between reported height and actual height was calculated.
You're testing the claim that the mean difference is greater than 0.8.
From the sample, the mean difference was 1, with a standard deviation of 0.8. Calculate the test statistic, rounded to two decimal places
Question 8:
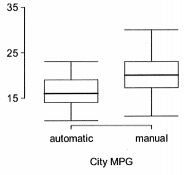
Each year the US Environmental Protection Agency (EPA) releases fuel economy data on cars manufactured in that year. Below are summary statistics on fuel efficiency (in miles/gallon) from random samples of cars with manual and automatic transmissions manufactured in 2012. Do these data provide strong evidence of a difference between the average fuel efficiency of cars with manual and automatic transmissions in terms of their average city mileage? Assume that conditions for inference are satisfied.
|
|
City MPG, Automatic
|
City MPG, Manual
|
|
Mean
|
16.12
|
19.85
|
|
SD
|
3.58
|
4.51
|
|
n
|
26
|
26
|
The hypotheses for this test are:
a. Ho: μautomatic = μmanual
Ha: μautomatic ≠ μmanual
b. Ho: μautomatic = μmanual
Ha: μautomatic > μmanual
c. Ho: μautomatic = μmanual
Ha: μautomatic < μmanual
The test statistic is: (please round to two decimal places)
The p-value is: (please round to four decimal places)
Interpret the result of the hypothesis test in the context of the problem:
CD The data provide sufficient evidence that there is a difference between the average fuel efficiency of manual and automatic cars in terms of their average city mileage
The data do not provide sufficient evidence that there is a difference between the average fuel efficiency of manual and automatic cars in terms of their average city mileage
The data provide sufficient evidence that there is no difference between the average fuel efficiency of manual and automatic cars in terms of their average city mileage
Question 9:
We considered the differences between the temperature readings in January 1 of 1968 and 2008 at 51 locations in the continental US in Exercise 5.19. The mean and standard deviation of the reported differences are 1.1 degrees and 4.9 degrees respectively.
(a) Calculate a 90% confidence interval for the average difference between the temperature measurements between 1968 and 2008.
lower bound: degrees(please round to two decimal places)
upper bound: degrees(p/ease round to two decimal places)
(b) Interpret this interval in context.
We are 90% confident that 90% of the time the differences in temperatures from year to year will be between the lower bound and upper bound
We are 90% confident that the true mean difference in temperatures is contained between the lower bound and upper bound
There is a 90% chance that the difference in temperatures in a city from year to year will be between the lower bound and upper bound
We are 90% confident that the mean difference in these sample temperatures is contained between the lower bound and upper bound
(c) Does the confidence interval provide convincing evidence that the temperature was higher in 2008 than in 1968 in the continental US? Explain.
No, because the confidence interval contains 0
Yes, because the confidence interval contains negative numbers 0 No, because the confidence interval is not very wide
Yes, because the confidence interval contains mostly positive numbers
Question 10:
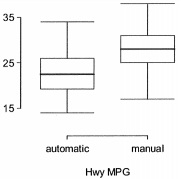
The table provides summary statistics on highway fuel economy of cars manufactured in 2012 (from Exercise 5.32). Use these statistics to calculate a 98% confidence interval for the difference between average highway mileage of manual and automatic cars, and interpret this interval in the context of the data.
|
|
Hwy MPG, Automatic
|
Hwy MPG, Manual
|
|
Mean
|
22.92
|
27.88
|
|
SD
|
5.29
|
5.01
|
|
n
|
26
|
26
|
lower bound: mpg (please round to two decimal places)
upper bound: mpg (please round to two decimal places)
Interpret your confidence interval in the context of the problem:
We can be 98% confident that our confidence interval contains the difference in average
highway mileage of the cars in our sample is contained within our confidence interval
We can be 98% confident that the difference in average highway mileage of manual and automatic cars is contained within our confidence interval
98% of manual and automatic cars will have a difference in highway mileage that falls within our confidence interval
Does your confidence interval provide significant evidence for a difference in the highway fuel efficiency of automatic versus manual cars? Explain.
yes, since 0 is not contained within our confidence interval 0 yes, since highway mileage cannot be negative
no, since 0 is not contained within our confidence interval 0 no, since negative highway mileage doesn't make sense
Question 11:
Give a 99% confidence interval, for μ1 - μ2 given the following information.
n1 = 30, x1 = 2.76 , s1 = 0.95
n2 = 25, x2 = 2.78 , s2 = 0.38
Use Technology Rounded to 2 decimal places.
Hint
Question 12:
Two samples are taken with the following numbers of successes and sample sizes
r1 = 25 r2 = 23
n1 = 74 n2 = 97
Find a 92% confidence interval, round answers to the nearest thousandth. <P1 - P2 <
Question 13:
Two samples are taken with the following sample means, sizes, and standard deviations
x1 = 22 x2 = 33
n1 = 57 n2 = 47
s1 = 2 s2 = 5
Estimate the difference in population means using a 92% confidence level. Use a calculator, and do NOT pool the sample variances. Round answers to the nearest hundredth.
< - /12 <
Question 14:
You wish to test the following claim (Ha) at a significance level of a = 0.001 .
Ho:P1 = P2
Ha:P1 ≠ P2
You obtain 85.1% successes in a sample of size ni = 489 from the first population. You obtain 83.6% successes in a sample of size n2 = 518 from the second population. For this test, you should NOT use the continuity correction, and you should use the normal distribution as an approximation for the binomial distribution.
What is the test statistic for this sample? (Report answer accurate to three decimal places.) test statistic
What is the p-value for this sample? (Report answer accurate to four decimal places.) p-value =
The p-value is...
less than (or equal to) a
greater than a
This test statistic leads to a decision to... 0 reject the null
accept the null
fail to reject the null
As such, the final conclusion is that...
There is sufficient evidence to warrant rejection of the claim that the first population proportion is not equal to the second population proprtion.
There is not sufficient evidence to warrant rejection of the claim that the first population proportion is not equal to the second population proprtion.
The sample data support the claim that the first population proportion is not equal to the second population proprtion.
There is not sufficient sample evidence to support the claim that the first population proportion is not equal to the second population proprtion.
Question 15:
You wish to test the following claim (Ha) at a significance level of a = 0.10 . For the context of this problem, μd = PostTest PreTest where the first data set represents a pre-test and the second data set represents a post-test. (Each row represents the pre and post test scores for an individual. Be careful when you enter your data and specify what your pi and u2 are so that the differences are computed correctly.)
Ho:μd = 0
Ha:μd ≠ 0
You believe the population of difference scores is normally distributed, but you do not know the standard deviation. You obtain the following sample of data:
|
pre-test
|
post-test
|
|
60.3
|
3.7
|
|
50.7
|
-5.9
|
|
36.7
|
17.2
|
|
32.5
|
22.6
|
|
53.8
|
34.3
|
|
49.2
|
61.2
|
|
51
|
61
|
|
44
|
47.2
|
|
58.4
|
35.3
|
|
27.7
|
36.8
|
|
45.1
|
37.3
|
|
41.3
|
8.4
|
|
46.9
|
37
|
|
60.3
|
29.2
|
|
42.8
|
41.4
|
What is the test statistic for this sample?
test statistic = (Report answer accurate to 4 decimal places.)
What is the p-value for this sample?
p-value = (Report answer accurate to 4 decimal places.)
The p-value is...
less than (or equal to) a 0 greater than a
This test statistic leads to a decision to... °reject the null
accept the null
fail to reject the null
As such, the final conclusion is that...
There is sufficient evidence to warrant rejection of the claim that the mean difference of post-test from pre-test is not equal to 0.
There is not sufficient evidence to warrant rejection of the claim that the mean difference of post-test from pre-test is not equal to 0.
The sample data support the claim that the mean difference of post-test from pre-test is not equal to 0.
There is not sufficient sample evidence to support the claim that the mean difference of post-test from pre-test is not equal to 0.