Reference no: EM132336036
Statistics T-Test for a Population Mean Assignment -
Q1. A manufacturer of sprinkler systems designed for fire protection claims that the average activating temperature is 135oF. A consumer rights activist believes that the average temperature is actually lower than this. To test the claim, he randomly selects a sample of 32 sprinkler systems and finds the mean activation temperature to be 133oF with a standard deviation of 3.3oF. At α = 0.10, does he have enough evidence to reject the manufacturer's claim?
(a) State the null and alternative hypotheses.
(b) Calculate the T-test statistic using the formula.
t = (x- - μ0)/(s/√n)
Round your answer to 2 decimal places.
(c) Give the degrees of freedom.
(d) Find the p-value using the tcdf on your calculator. Round your answer to 4 decimal places.
DISTR
(Go to 2nd Type tcdf(leftbound, rightbound, degrees of freedom).) VARS
(e) State your decision (reject the null hypothesis or fail to reject the null hypothesis).
(f) State your conclusion about the population mean activating temperature.
Q2. A scientist claims that the mean nitrogen dioxide level in a certain city is greater than 30 ppb (parts per billion). To test this claim, you determine the nitrogen dioxide levels on 20 randomly selected days. The results (in ppb) are shown below. At α = 0.01, do you have enough evidence to support the scientist's claim?
29 37 45 35 30 41 40 44 42 33 34 30 30 43 26 40 25 42 30 27
(a) State the null and alternative hypotheses.
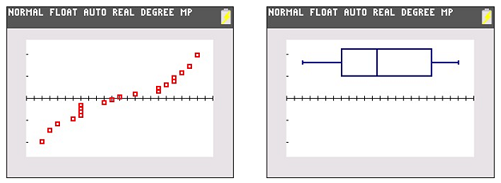
(b) A normal probability plot and box-plot of the data are shown below. Do the plots indicate that the data comes from a normal distribution and contains no outliers?
(c) Use your graphing calculator to perform a T-Test. First, give the test statistic, t, and the degrees of freedom.
(d) Give the p-value.
(e) State your decision.
(f) State your conclusion about the population mean nitrogen dioxide level.
Q3. Use the T-test on your graphing calculator to test the hypotheses H0: μ = 75 at the significance H1: μ ≠ 75 level α = 0.05. The sample statistics are x- =76.2, s = 5.3, n = 64.
(a) Give the value of the test statistic and the degrees of freedom.
(b) Give the P-value.
(c) State your decision.
(d) Use the TInterval procedure to construct a 95% confidence interval for the population mean.
(e) Does this interval contain μ0 = 75? Does this confirm the decision you made in part (c)?
Note - Must use a scientific calculator.