Find the model that best explains

Assignment Help Econometrics
Reference no: EM131897689

Learning outcomes

The following learning outcomes will be assessed in TMA 02:

  • to identify and understand relationships within the data
  • to be able to design a quantitative research methodology to explore a finance research problem to conduct time series and cross-sections regression analyses
  • to be able to identify relevant theories in the finance literature and to test hypotheses
  • to be able to distinguish and choose amongst the range of methods available for the collection of evidence (data) and understand the characteristics of this evidence.

Introduction

In this TMA, you will practise hypothesis tests on single variables as well as the design of multiple regression models and associated hypothesis tests. The data for this TMA are based on the World Economic Outlook (WEO) and it is similar to what you saw in Session 4 of Unit 5. The quantitative data you will use in this TMA are located in the file B860_17K_TMA02_dataset.xlsx. Table 1 describes the variables contained in this file.

Table 1. Codes and descriptions of the variables in the dataset

Variable Code            Description

PPPPGDPlog      Gross domestic product based on purchasing-power-parity (PPP) per capita GDP (natural logarithm), in current international dollars; 2015

GFCF                  Average total investment as percentage of GDP; 2010-2015

GOV_EXP           Average general government total expenditure as a percentage of GDP; 200-2015

TAXTOT             Average Taxes on income, profits, and capital gains, percentage of total tax revenue 2004-2014 NETMR      Average net migration rate per 1000 people, 2010-2015

REMIN                Remittances inflows as percentage of GDP, 2015

DCBFS                Domestic credit provided by financial sector as percentage of GDO, 2010-2015

TOTUN               Total Unemployment as percentage of total labour force, 2015 FDINI         Foreign direct investment, net inflows, 2015

INTU                   Internet users as percentage of total population, 2015

HDIAGR              Average annual HDI (Human Development Index) growth, 1990-2015 INEQIN  Inequality in income, 2015

SHSIT                 Share of seats in parliament held by women, 2015

AAPOPGR          Average Annual Population growth (natural logarithm); 2010-2015

SPPSE                Population with at least some secondary education, percentage ages 25 and older MRU5        Average mortality rate under 5 years per 1000 live births, 2010-2015

CC                      Country name as identification variable

CO                      The continent on which the country is located

Question 1

Descriptive statistics

Produce a table with the mean, median, minimum, maximum, standard deviation and skewness for the following variables in this dataset: PPPPGDPlog, GFCF, GOV_EXP, TAXTOT, and NETMR. One constraint applies to your calculation of the mean, standard deviation and skewness: You are not allowed to use the Data Analysis Toolpak in Excel or any of these functions: stdev.p, stdev.s, stdeva, stdevpa, stdev, stdevp, skew.

Question 2

Group differences

Compare GDP per capita (PPPPGDPlog) for three groupings of countries. Define three pairs of country groups as follows:

- Split by continent: European countries vs Asian countries.

- Split by name of the country: Countries beginning with letters A-L vs countries beginning with letters M-Z.

- Split by median of inequality in income (i.e. INEQIN): find the median of the variable and select all countries below and equal to the median in the first group and all countries above the median in the second group.

Do you expect a group difference for the mean logarithm of GDP per capita in these comparisons? Why or why not?

Apply an appropriate test to assess whether the mean logarithm of GDP per capita is different between the two groups in each of the above grouping.

Question 3

Interpretation of multiple regression

Table 2 shows the results for a regression of GDP per capita (log) on six variables at the country level.

Table 2. Regression of GDP per capita on country characteristics

SUMMARY OUTPUT

SUMMARY OUTPUT

 Regression Statistics

Multiple R

 0.7528

R Square

0.5667

Adjusted R Square

0.5352

Standard Error

0.8267

Observations

134


ANOVA


df


SS


MS


F


Significance F

Regression

9

110.8340

12.3149

18.0177

0.0000

Residual

124

84.7524

0.6835


Total

133

195.5864


Coefficients


Standard Error


t Stat


P-value


Lower 95%


Upper 95%

Intercept

7.5678

0.3812

19.8523

0.0000

6.8133

8.3224


GFCF

0.0000

0.0109

-0.0005

0.9996

-0.0216

0.0216

GOV_EXP

0.0183

0.0149

1.2258

0.2226

-0.0112

0.0478

TAXTOT

0.0252

0.0072

3.4883

0.0007

0.0109

0.0394

NETMR

0.0360

0.0099

3.6261

0.0004

0.0163

0.0556

DCBFS

0.0046

0.0015

3.1163

0.0023

0.0017

0.0075

TOTUN

-0.0167

0.0112

-1.4936

0.1378

-0.0389

0.0054

FDINI

-0.0035

0.0070

-0.4977

0.6196

-0.0175

0.0104

Europe

1.4054

0.2139

6.5716

0.0000

0.9821

1.8287

Asia

0.7087

0.1999

3.5457

0.0006

0.3131

1.1043

You are required to:

a. Write down the estimated equation for the model estimated in this regression.

b. Interpret the results also in terms of relationship between dependent and explanatory variables. Does the model explain GDP per capita? Which variables explain GDP per capita? Which do not?

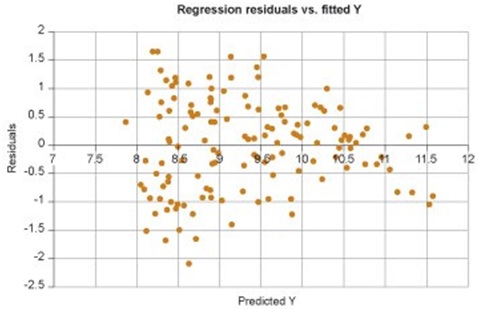
c. Look at the graph below about the residuals versus fitted Y. For which assumption of the linear model is this graphical analysis used? Do you think that this regression output violates this specific assumption or not? Justify your answer.

1005_Regression output.jpg

d. Find the countries with the largest positive and negative residuals from this regression (e.g., using the dataset in combination with the regression results). How can you interpret the large residuals shown by these two countries?

Question 4

Finding the best fit

a. Find the model that best explains GDP per capita (log) and which only uses explanatory variables that are significantly different from zero. Select variables from the dataset B860_17K_TMA02_dataset.xlsx as appropriate and justify the approach you take to arrive at the best model.

b. Explain whether you think the estimated coefficients in this model provide a recipe to increase a country's GDP per capita.

Attachment:- Dataset.rar

Verified Expert

In this assignment, student asked us to do only calculation part of the task. Q1 and Q2 requires calculation whereas Q3 is the explanation which he mentioned in the mail as he will do by himself. please read the requirement.

Reference no: EM131897689

Questions Cloud

Create intervention designed to address particular concern : Social influence is pervasive. Understanding mechanisms by which our own behavior is influenced can help us intentionally shape the behavior of others.
Interest on the margin loan : You purchased 200 shares of CNX common stock on margin at $50 per share. Assume the stock pays no dividends, and you pay no interest on the margin loan.
What follows is some background on qutb and information : What follows is some background on Qutb and information about what I what you to do in your essay.
What is the investor rate of return : The stock pays $0.92 per share dividend each year. If the stock is sold at the end of the year at $25 per share, what is the investor's rate of return?
Find the model that best explains : Find the model that best explains GDP per capita (log) and which only uses explanatory variables that are significantly different from zero
What is new value of index divisor after the substitution : What is the new value of the index divisor, after the substitution?
Describe the social situation of social psychological theory : To prepare for this journal, watch Social Influence (2017). Reflect on this topic. Specifically, consider concepts other than those covered in discussions.
Describe variables that affect demand and supply for bonds : Describe variables that affect demand and supply for bonds? How do the supply curve and demand curve shift if the variables increase?
Which requirements are most frequently met : Utilizing Zilbergeld's five conditions for "good sex," identify media characters or relationships (personal or hypothetical examples can be used) that meet.

Reviews

inf1897689

4/19/2018 6:33:35 AM

Where is the solution of question 3 and 4? no. i just need bullets. dont need any words. Give me the bullets for 3 and 4. Ok, please do this as I need to submit it today itself. The writer has to completed the question 2 between Europe and Asian countries. In 2nd question it says. "Apply an appropriate test to assess whether the mean logarithm of GDP per capita is different between the two groups in each of the above grouping". Please ask her to answer the question and 3 completely as discussed over the chat. Please confirm for q4as well. Are you giving me atleast q2 and 3 properly written? Anyway ask her to write the proper answer for 2 and 3 in the word file. and attach excel for third question as well. Thanks. No. Jut give me q2 and 3 properly done. its 7 here. just 2more hours u got. I need to submit my work today. In how much time can i receive the work?

len1897689

3/12/2018 3:47:23 AM

The word limit for this TMA is 2500 words. Due to the nature of the assignment and inclusion of a spreadsheet for part of it, answers may be considerably shorter than this limit and still attract full marks if they succinctly address all parts of the question. A good strategy would be to answer the questions first and then only worry about the word limit if you exceed it. Tutors are advised to only mark up to 2750 words (i.e. the word limit plus 10%). Work beyond that will not be given any marks. Content in the spreadsheet will not be included in the word count, but you should only include essential text in the spreadsheet, with your written explanations being in the document and referencing the spreadsheet. The eTMA system will only accept one file, so you will need to create and then upload a .zip file that contains your answer file (usually a Word document) and your workings in an Excel spreadsheet. There is a brief guide to creating a zip file here and more detailed guidance here.

len1897689

3/12/2018 3:47:11 AM

Hi, Please see the question properly with all the data sent and attachments. I do not need the words but calculations. Only if you are sure you can deliver the right solutions, do accept the work. Lately, the writers accept the work without looking at the whole sheet and later are unable to meet the deadline. Please ask the writer to accept the work only if doubly sure to complete the work in given time. Submit an Excel spreadsheet that shows your workings along with your main answer file. For example, if you are using several regression models in Question 4, please show and explain the important steps that enable the reader to follow your logic when working towards the solution.

Write a Review

Econometrics Questions & Answers

  What is total financial wealth in the economy

Suppose there are n people born each period. What is total saving in the economy? (Hint: Add up the saving of each age group. Remember that some age groups may have negative saving.) Explain.

  Derive the government expenditure and tax multiplier

Derive the government expenditure and tax multiplier

  What is chinas opportunity cost of producing wheat

In China, it takes 100 hours to produce 1 digital camera or 4 hours to produce 1 lb. of wheat. In S. Korea, it takes 60 hours to produce 1 digital camera or 3 hours to produce 1 lb. of wheat. What is China's opportunity cost of producing one pound of..

  Compare the annual costs and using minimum attractive return

A proposed material for covering the roof of a building will have an estimated life of 8 years and will cost 5.000$. A heavier grade of this roofing material will cost 1.400$ more but will have an estimated life of 12 years.

  Compute the quantity sold and the own price elasticity

Robinson Plastics makes clear plastic products with injection molding techniques. Their latest invention is a plastic cup with a sharp blade mounted inside to cut prescription pills into small pieces.

  Determine what is the stocks beta and rate of return

A stock has a required return of 11%; the risk-free rate is 4%; and the market risk premium is 6%. What is the stock's beta Round your answer to two decimal places.Portfolio required return Suppose you are the money manager of a $4.89 million inves..

  How much carpet must be re-manufactured annually

Each year in the United States nearly 5 billion pounds of discarded carpet end up in land fills. In response to this situation, the carpet manufacturer has decided to start a take-back program whereby obsolete carpet is reclaimed at the end of its..

  How to select the better system based on bc analysis

A city government is considering two types of town dump sanitary systems, as shown below. Select the better system based on BC analysis at 8% social discount rate (same as MARR). Design A Design B Initial investment $400,000 $300,000

  What is the probability of this happening

The system is operational if there is a path that starts at point A. ends at point B. and consists of operational components. What is the probability of this happening?

  How much energy is released in the explosion

How much energy is released in the explosion of a fission bomb containing 3.0 kg of fissionable material? Assume that 0.10% of the mass is converted to released energy

  What is the short-run price elasticity of supply

If these salaries are expected to remain high, will more people enter doctoral programs in economics? How would such entry affect the longrun price elasticity of supply? V

  Why the demand deposits on the liabilities side

demand deposits on the liabilities side of its balance sheet. Assets Liabilities Reserves $36,000 Demand Deposits $300,000 Loans If the legal reserve requirement is only 5%, the balance sheet above shows that the bank holds

Free Assignment Quote

Assured A++ Grade

Get guaranteed satisfaction & time on delivery in every assignment order you paid with us! We ensure premium quality solution document along with free turntin report!

All rights reserved! Copyrights ©2019-2020 ExpertsMind IT Educational Pvt Ltd