Reference no: EM13906396
Part A- MEASURES OF CENTRAL TENDENCY
Fill in the blanks:
1. The score that repeats the most often in a distribution is called the ______.
2. The descriptive statistic used the most in inferential statistics as a measure of central tendency is the _________.
3. The measure of central tendency used with nominal scale data is the _______.
4. To find the mean of a sample, thethe sum of the scoresas is divided by ______.
Circle the correct answer:
5. In a positively skewed distribution, the majority of the scores cluster above/below the ________.
6. The mode and the mean have the same values in distributions that are normal/negatively skewed.
7. Distributions with few scores are more/less likely to have a mode than distributions with many scores.
Answer the following questions:
8. Which measure of central tendency would be the most appropriate for summarizing the following test scores? Explain your choice.
13, 14, 10, 38, 11, 12, 16, 15
9. What is the difference between X¯ and μ? How are they related to each other?
10. A distribution of 10 scores has a mean of 6. Following are 9 scores of this distribution. Which score is missing (remember that the mean should be 6)?
4, 8, 10, 5, 9, 3, 6, 7, 3
11. When the sum of a group of scores is 280 and the mean of the scores is 7, how many scores are in the distribution?
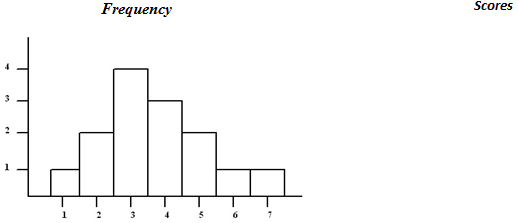
12. Find the mode, median, and mean of the distribution depicted in the following histogram:

Part B- MEASURES OF VARIABILITY
Circle the correct answer:
1. The distance between the highest and the lowest scores is called the range/variance.
2. The SD is equal to the square root of the mean/variance.
3. A test with 30 items is likely to have a higher/lower standard deviation that a test with 80 items.
4. The mean of the squared deviation scores is called the variance/standard deviation.
5. The SD of the number of errors found by an auditor in a sample of accounts of one company is likely to be higher/lower than the SD of the number of errors found in samples taken from a number of different companies.
6. The SD is/is not sensitive to extreme scores.
7. The variance of the population is represented by S2/σ2.
8. In most cases, the variance is larger/smaller than the SD.
9. The measure of variability that takes into consideration every score in the distribution is the range/standard deviation.
Answer/compute the following questions:
10. Study the following three distributions. What are the similarities and differences between the three distributions in terms of their means, ranges, and standard deviations? (Note: Assume the three distributions to be samples if you decide to compute their standard deviations.)
Distribution A: 8, 9, 6, 12, 5
Distribution B: 7, 10, 11, 8, 4
Distribution C: 7, 9, 8, 9, 7
11. Three statistics classes (Sections A, B and C), each with 26 students, took the same test. The SD of Section A was 7; the SD of Section B was 16; and the SD of Section C was 10. Which class was more homogeneous in regard to the scores on the test?
12. Means and standard deviations were calculated for an Overall Quality Assurance Test with 45 items. This test consists of 20 Input Factors and 25 Output Factors. Estimate which of the following standard deviations was obtained for the total Quality Assurance Test and which standard deviation was obtained for the Input factors.
a. SD = 5.7 b. SD = 8.3
13. Shortly after being hired, eight sales trainees participated in a role playing exercise where they were rated on a scale of 1-10 on their ability to close a sale. After one week of training, the same eight sales trainees participated in the same role playing exercise and their closing skills were evaluated using the same scale of 1-10.
Review the following scores. Is there a difference between the pre-training and post-training rating scores? What effect, if any, did the training have on the trainees? Explain.
|
Trainee
|
Pre-training
|
Post-training
|
|
|
|
|
|
A
|
9.5
|
9.1
|
|
B
|
7.8
|
8.9
|
|
C
|
9.9
|
9.1
|
|
D
|
8.6
|
8.8
|
|
E
|
8.2
|
8.8
|
|
F
|
9.6
|
9.0
|
|
G
|
8.6
|
8.9
|
|
H
|
9.1
|
9.0
|
|
|
|
|
|
Mean
|
8.91
|
8.95
|
|
SD
|
0.73
|
0.12
|
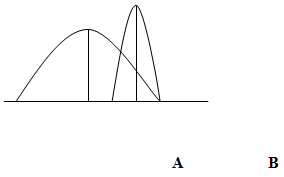
14. Following is a graph showing two distributions weekly incomes of employees working in the same industry. The means and standard deviations of the two groups are also given. Estimate which of the two means and which of the two SDs belong to each group of students.
Mean = $530 SD = $70
Mean = $690 SD = $150

Group A: The mean is ______ and the SD is _______
Group B: The mean is ______ and the SD is _______