Find the fourier transforms for the waveforms

Assignment Help Simulation in MATLAB
Reference no: EM131484248

Lab- Matlab - Fourier

Question 1

Find the Fourier transforms for the following waveforms. Plot the waveforms and their magnitude spectra. [Hint: Use Eq. (2-184)
(a) Π(t-3)/4.

(b) 2.

(c) ∧(t - 5)/5

Question 2

By using Eq, (2-184), find the approximate Fourier transform for the following waveform:

          sin(2Πt/512) + sin(70Πt/512), 5 < t < 75     

x(t) =
           0,                     t elsewhere

Question 3

Using a computer program, calculate the DFT of a rectangular pulse, Π(t). Take five samples of the pulse and pad it with 59 zeros so that a 64-point FFT algorithm can be used. Sketch the re-sulting magnitude speculum Compare this result with the actual spectrum for the pulse. Try other combinations of the number of pulse samples and zero-pads to see how the resulting FFT changes.

Lab - Matlab - SNR

Question 1

For a 4-bit PCM system, calculate and sketch a plot of the output SNR (in decibels) as a function of the relative input level, 20 log (xrms/V) for
(a) A PCM system that uses μ = 10 law companding.
(b) A PCM system that uses uniform quantization (no companding).
(c) Which of these. systems is better to use in practice? Why?

Question 2
The performance of a μ = 255 law companded PCM system is to be examined when the input consists of a sine. wave having a peak value of V volts. Assume that M = 256.
(a) Find an expression that describes the output SNR for this companded PCM system.
(b) Plot (S/N)out (in decibels) as a function of the relative input level, 20 log (xrms,/V), Compare this result with that shown in Fig. 3-10.

Lab - Matlab - PSD

Question 1

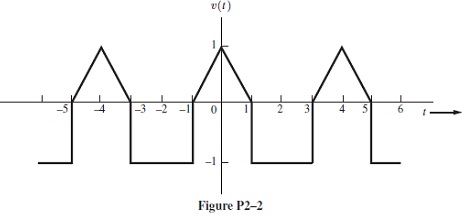
Evaluate the ND for the waveform shown in Fig. P2-2.

750_Figure.jpg

Question 2
In Fig. 3-16, the PSDs for several line codes are shown. These PSDs were derived assuming unity power for each signal so that the PSDs could be compared on an equal transmission power basis. Rederive the PSDs for these line codes, assuming that the peak level is unity (i.e., A = 1). Plot the PSDs so that the spectra can be compared on an equal peak-signal-level basis.

133_Figure1.jpg

Lab- Matlab - DC and RMS

Question 1

Use v(t) = ae-at, a > 0, to approximate δ(t) as a → ∞
(a) Plot v(t) for a = 0_1, 1, and 10,
(hi Plot 1/(1) for a = 1, and 10,

Lab - Matlab- Bandpass signaling

Question 1

Let the transfer function of an ideal bandpass filter be given by

2121_Figure4.jpg

where BT is the absolute bandwidth of the filter.

(a) Sketch the magnitude transfer function |H(f)|
(b ) Find an expression for the waveform at the output, v2(t), if the input consists of the pulsed carrier

v1(t) = AΠ(t/T) cos(ωct)

(c) Sketch the output waveform v2(t) for the case when BT= 4/T and fc >> BT.

(Hint: Use the complex-envelope technique, and express the answer as a function of the sine integral, defined by

 Si(u) = 0usinλ/λ.dλ

The sketch can be obtained by looking up values for the sine integral from published tables [Abramowitz and Stegun, 1964] or by numerically evaluating Si (u).

Question 2:

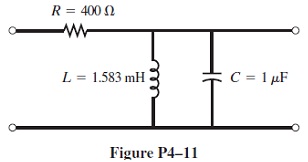
A bandpass filter as shown in fig P4-11 has the transfer function

H(s) = Ks/(s2 + (ω0/Q)s + ω02)

where Q = R√(C/L) the resonant frequency is fo = 1/(2Π√LC), ω0 = 2Πf0, K is a constant, and values for R, L, and C are given in the figure. Assume that a bandpass signal with fc = 4 kHz and a bandwidth of 200 Hz passes through the filter, where f0 =fc.

899_Figure2.jpg

(a) Using Eq. (4-39), find the bandwidth of the filter.
(b) Plot the carrier delay as a function of f about fo.
(c) Plot the group delay as a function of f about fo.
(d) Explain why the filter does or does not distort the signal.

Lab - Matlab- Modulated signals and filters

Question 1

Plot the amplitude response, the phase response, and the phase delay as a function of frequency for the following low-pass filters, where B= 100 Hz:

1465_Figure3.jpg

(a) Butterworth filter, second order:

H(f) = 1/(1+√2(if/B) + (jf/B))2

(b) Butterworth filter, fourth order:

H(f) = 1/[(1+ 0.765(jf/B) + (jf/B)2][1 + 1.848(jf/B) + (jf/B)2]

Compare your results for the two filters.

Question 2

The nonlinear output-input characteristic of an amplifier is

vout(t) = 5vin(t) + 1.5v2in(t) + 1.5v3in(t)

Assume that the input signal consists of seven components:

Vin(t) = 1/2 + 4/Π26k=1 1/(2k -1)2.cos[(2k - 1)Πt]

(a) Plot the output signal and compare it with the linear output component 5vin(t).

(b) Take the FFT of the output vout(t), and compare it with the spectrum for the linear output component.

Reference no: EM131484248

Questions Cloud

Create a communication plan for mother and child : Identify the resources currently available in your state (Florida) to support this family in the care of this child, including assistance programs .
Stimulated investment and growth : If tax breaks for the rich really stimulated investment and growth, wouldn't everyone benefit from them? Why would anyone oppose them?
Select one article that utilizes a quantitative research : Select a health topic of interest to you that is relevant to your current area of practice. The topic may be your Course Portfolio Project or a different topic
Eliminate the uncertainties of fluctuating crop prices : Farmers can eliminate the uncertainties of fluctuating crop prices by selling their crops in futures markets.
Find the fourier transforms for the waveforms : Find the Fourier transforms for the waveforms. Plot the waveforms and their magnitude spectra - find the approximate Fourier transform for the waveform
Find the NPV in dollars for the American firm : Find the NPV in dollars for the American firm if they wait one year to buy the bond after the exchange rate rises to S1($|€) = $1.80 per €
Who gains or loses from such regulation : You need a government permit (allotment) to grow tobacco. Who gains or loses from such regulation?
Describe the pathophysiology of gastric acid stimulation : Explain the changes that occur to gastric acid stimulation and production with GERD, PUD, and gastritis disorders.
Assignment-to build or buy : Select a small business that you visit often (e.g., coffee shop, bookstore, sporting goods store, etc.). Write a 6-8 page paper in which you:

Reviews

Write a Review

Simulation in MATLAB Questions & Answers

  Write matlab to display even component and odd component

Write a MATLAB script to do the Display v(t) and vi(2t-1) in window 1 by using subplot. Display both the even component and odd component of v(0 in window 2.

  Perform the closed loop system using block diagram

Build the closed loop system using Simulink-Find poles, zeros and pole-zero map for the closed loop system-Perform the closed loop system using block diagram

  Plot the original periodic square wave

Plot the original periodic square wave on the same graph. Comment on the difference between the original periodic square wave and its truncated Fourier series presentation.

  Create a vector with options variable

NSE 115 Homework - Functions and Control Flows. Create a vector with Options variable, i.e., Activity, NumAtoms, Both, and create a for loop that calls for your function such that it returns each of the following plots: Plot of number of atoms over..

  Find the roots for polynomials shown using matlab

INLAB Report (1): Find the roots for polynomials shown above using MATLAB. Can you guess a function which finds "roots" for polynomials in MATLAB? Use help in MATLAB to find the syntax for function

  Evaluate the given series of equations using matlab

Evaluate the following series of equations using MATLAB. Convert each of the three equations to frequency domain both by using the MAT lab command and by hand. These equations are determined in MATLAB using the laplace(F) command.

  Is it possible tom will catch jerry in his life time

Use Adam-Bashforth Technique with your result from Runge-Kutta method as initial step to compute when will Tom catch Jerry. Suppose Tom's acceleration is unknown someone found did not catch Jerry in 2 minutes. Is it possible Tom will catch Jerry in ..

  Queuing simulator

Queuing Simulator: Consider a communications router that can route (service) EXACTLY 800 messages per second (mps). Assume that messages arrive at an AVERAGE rate of 850 messages per second. Assume that the arriving messages follow an exponential dis..

  Compute average value and standard deviation of population

Compute the average value and standard deviation of the population. In your Excel sheet, fill the average value cell with a red background and outline the standard deviation cell with a black border.

  Simulate using beam propagation method

Simulate using BPM (Beam propagation method) the following wave guid?

  Use matlab to plot the periodic square wave

Use MATLAB to plot the periodic square wave 5 f(t) over the time interval 0 ≤ t ≤ 3T  . On the same graph, plot the output waveforms, f0(t), of the two amplifiers with corner frequencies of F =  10I and F = 40I, respectively.

  Analysis of a two-dimensional mixing chamber

A project for a fuel cell company requires the analysis of a two-dimensional mixing chamber depicted in Figure 1

Free Assignment Quote

Assured A++ Grade

Get guaranteed satisfaction & time on delivery in every assignment order you paid with us! We ensure premium quality solution document along with free turntin report!

All rights reserved! Copyrights ©2019-2020 ExpertsMind IT Educational Pvt Ltd