Reference no: EM137968
1. A forester wishes to predict the volume (in cubic feet) of usable lumber in a certain species of tree using the height (in feet) and diameter (in inches) of the trees. The height and diameter of 31 trees of a certain species were measured, the trees were cut down, and the volume of usable lumber was determined. The explanatory variable(s) in this study are

A. either height or diameter.
B. both height and diameter.
C. height, diameter, and volume.
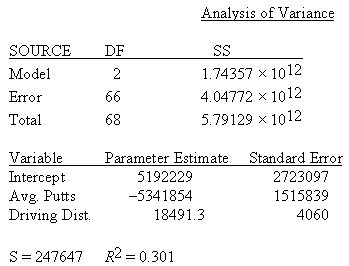
2. An old saying in golf is "you drive for show and you putt for dough." The point is that good putting is more important than long driving for shooting low scores and hence winning money. To explore the relation between winning, putting, and driving distance, data on the top 69 money winners on the PGA tour in 1993 are used. The average number of putts per hole for each player and their average driving distance is used to predict their total winnings using the multiple regression model
where the deviations εI are assumed to be independent and Normally distributed with mean 0 and standard deviation σ. This model was fit to the data using the method of least squares. The following results were obtained from statistical software.

To see if higher winnings are associated with fewer putts, the researchers decided to test the hypotheses H0: β1 = 0 , Ha: β1 < 0. The P-value of the test is
A. less than 0.0005.
B. between 0.0005 and 0.01.
C. greater than 0.01.
|
Example on multiple linear regression model
: This model is fit to the data using the method of least squares using statistical software, and the following parameter estimates and their standard errors are obtained.
|
|
Evaluate average driving distance
: An old saying in golf is "you drive for show and you putt for dough." The point is that good putting is more important than long driving for shooting low scores and hence winning money.
|
|
Multiple regression model
: where the deviations εi are assumed to be independent and Normally distributed with mean 0 and standard deviation σ. This model was fit to the data using the method of least squares. The following results were obtained from statistical software.
|
|
Regression model
: The average number of putts per hole for each player and their average driving distance is used to predict their total winnings using the multiple regression model where the deviations εI are assumed to be independent and Normally distributed with..
|
|
Find the explanatory variables in this study
: The height and diameter of 31 trees of a certain species were measured, the trees were cut down, and the volume of usable lumber was determined. Find the explanatory variable(s) in this study are
|
|
Projectile on the moon to reach its greatest height
: A toroidal solenoid has a mean radius of 11.0 cm and a cross-sectional area of 5.00 cm2 and is wound uniformly with 100 turns. A second coil with 500 turns is wound uniformly on top of the first. What is the mutual inductance of these coils.
|
|
Determine the estimated final velocity of the cart
: For safety in climbing, a mountaineer uses a nylon rope that is 69 m long and 1.0 cm in diameter. Whilst supporting a 96-kg climber, the rope elongates 1.4 m. Find its Young's modulus.
|
|
The mirror of the nearest point on the floor
: A person whose eyes are H = 1.64 m above the floor stands L = 2.3 m in front of a vertical plane mirror whose bottom edge is 38 cm above the floor. What is the horizontal distance x to the base of the wall supporting the mirror of the nearest point o..
|
|
Plot of residuals from a regression
: Below is a normal plot of residuals from a regression. Does the plot indicate any problems with the assumption that the residuals are Normally distributed
|