Reference no: EM13866222
Assignment: Problem Solving-Hypothesis Testing with Two Samples
1. Classify the two given sample as independent or dependent.
Sample 1: The average time for 48 amateur skiers to finish a race
Sample 2: The average time for the same 48 amateur skiers to finish a race after participating in a training program
2. For the given data,
a. Find the test statistic,
b. Find the standardized test statistic,
c. Decide whether the standardized test statistic is in the rejection region,
d. Decide whether you should reject or fail to reject the null hypothesis.
The samples are random and independent.
Claim: μ1 = μ2, α = 0.05. Sample statistics: X1‾= 16, s1 = 0.9, n1 = 40 and X2‾= 13, s2 = 1.4, n2 = 60
3. Use the given sample statistic to test the claim about the difference between two population means μ1 and μ2 at the given level of significance α.
Claim: μ1 > μ2, α = 0.01. Statistics: X1‾ = 5.2, s1 = 0.2, n1 = 43 and X2‾= 5.4, s2 = 0.4, n2 = 37
a. Determine the critical value(s).
b. Determine the rejection region.
c. Calculate the standardized test statistic.
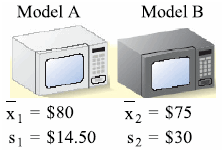
4. You want to buy a microwave oven and will choose Model A if its repair costs are lower than Model B's. You research the repair costs of 44 Model A ovens and 56 Model B ovens. The results of your research are shown in the figure to the right. At α = 0.01, would you buy Model A? Assume the samples are randomly selected and that the samples are independent. Complete parts (a)-(e).
a. Identify the claim and state H0 and Ha.
b. Find the critical value(s) and identify the rejection region(s).
c. Find the standardized test statistic z.
d. Decide whether to reject or fail to reject the null hypothesis.
e. Interpret the decision in the context of the original claim.
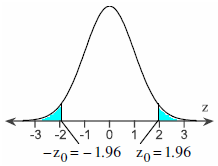
5. A group says that the mean daily lodging cost for a family traveling in Region 1 is the same as in Region 2. For 55 families traveling in Region 1, X1‾ = $132 and s1 = $32. For 55 families traveling in Region 2, X2‾ = $137 and s2 = $25. At α = 0.01, is there enough evidence to reject the group's claim? Complete parts (a) through (e).
a. Identify the claim and state H0 and Ha.
b. Find the critical value(s) and identify the rejection region(s).
c. Find the standardized test statistic z.
d. Decide whether to reject or fail to reject the null hypothesis.
e. Interpret the decision in the context of the original claim.
6. Is the difference between the mean annual salaries of statisticians in Region 1 and region 2 more than $6000? To decide, you select a random sample of statisticians from each region. The results of each survey are shown to the right. At α = 0.01, what should you conclude?
|
Region 1
|
Region 2
|
|
x1 = $68,200
|
x1 = $61,000
|
|
s1 = $8875
|
s2 = $9175
|
|
n1 = 48
|
n2 = 43
|
7. What conditions are necessary in order to use a t-test to test the difference between two population means?
8. Use the t-distribution table to find the critical value(s) for the indicated alternative hypotheses, level of significance α, and sample sizes n1 and n2. Assume that the samples are independent, normal, and random.
Answer parts (a) and (b).
Ha: μ1 < μ2, ?? = 0.01, n1 = 8
a. Find the critical value(s) assuming that the population variances are equal.
b. Find the critical value(s) assuming that the population variances are not equal.
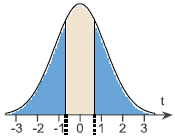
9. Use the given information to answer parts (a) through (d).
Ha: μ1 = μ2, ?? = 0.50
Sample statistics: X1‾ = 34.2, s1 = 3.7, n1 = 7
X2‾= 36.5, s2 = 2.6, n2 = 10
Assume σ21 = σ22.
-t0 = -0.691, t0 = 0.691
a. Find the test statistic.
b. Find the standardized test statistic.
c. Decide whether the standardized test statistic is in the rejection region.
d. Decide whether you should reject or fail to reject the null hypothesis.
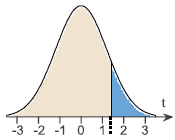
10. Use the given information to answer parts (a) through (d).
H0: μ1 ≤ μ2, ?? = 0.10
Sample statistics: X1‾ = 2259, s1 = 159, n1 = 18
X2‾= 2316, s2 = 49, n2 = 8
Assume σ21 ≠ σ22.
t0 = 1.415
a. Find the test statistic.
b. Find the standardized test statistic.
c. Decide whether the standardized test statistic is in the rejection region.
d. Decide whether you should reject or fail to reject the null hypothesis.
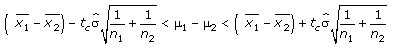
11. Construct a 95% confidence interval for μ1 - μ1 with the sample statistics for mean calories content of two bakeries' specialty pies and confident interval construction formula below. Assume the populations are approximately normal with equal variances.

Stats
Confidence
Interval when variance are equal
Where
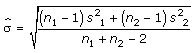
and d.f. = n1 + n2 - 2
< μ1 - μ2<
12. What conditions are necessary in order to use the dependent samples t-test for the mean of the difference of two populations?
13. Test the claim below about the mean of the difference of two populations. Use a t-test for dependent, random samples at the given level of significance with the given statistics. Is the test right-tailed, left -tailed, or two-tailed? Assume the populations are normally distributed.
Claim: μd = 0, α = 0.01. Statistics: d‾= 2.8, sd = 3.17, n = 14
14. The table below shows the critical reading scores for 14 students the first two times they took a standardized test. At α = 0.01, is there enough evidence to conclude that their scores improved the second time they took the test? Complete parts (a) through (f).
|
Student
|
1
|
2
|
3
|
4
|
5
|
6
|
7
|
8
|
9
|
10
|
11
|
12
|
13
|
14
|
|
Score on the first test
|
640
|
419
|
423
|
498
|
617
|
428
|
353
|
491
|
632
|
524
|
320
|
586
|
569
|
412
|
|
Score on second test
|
648
|
497
|
489
|
527
|
564
|
445
|
339
|
633
|
700
|
586
|
347
|
605
|
617
|
424
|
a. Identify the claim and state H0 and Ha.
Let μd be the hypothesized mean of the students' first score minus their second score. State H0 and Ha.
b. Find the critical value(s) and identify the rejection region(s).
c. Calculate d‾ and sd.
d. Use the t-test to find the standardized test statistic t.
e. Decide whether to reject or fail to reject the null hypothesis.
f. Interpret the decision in the context of the original claim.
15. Construct a 90% confidence interval, using the inequality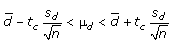 . To test the effectiveness of a new drug that is reported to increase the number of hours of sleep patients get during the night, researchers randomly select 13 patients and record the number of hours of sleep each gets with and without the new drug.
|
Patient
|
1
|
2
|
3
|
4
|
5
|
6
|
7
|
8
|
9
|
10
|
11
|
12
|
13
|
|
Sleep without the drug
|
4.4
|
4.8
|
4.8
|
4.9
|
4.8
|
4.4
|
3.9
|
2.4
|
2.1
|
3.4
|
1.8
|
4.8
|
4.8
|
|
Sleep using the drug
|
6.9
|
7.2
|
7.3
|
5.6
|
6.6
|
6.9
|
5.3
|
4.6
|
3.0
|
5.7
|
3.9
|
6.3
|
7.3
|
Calculate the confidence interval.
16. Test the following claim about the difference between two population proportions p1 and p2 for the given level of significance α and the given sample statistics. Is the test right-tailed, left-tailed, or two-tailed? Assume the sample statistics are from independent random samples.
Claim: p1 ≠ p2, α = 0.01
Sample statistics: x1 = 32, n1 = 48 and x2 = 27, n2 = 58
17. In a study of 1492 adults, 456 said they has used alternative medicines in the previous year. In a more recent study of 2713 adults, 966 said they had used alternative medicines in the previous year. At α = 0.05, can you reject the claim that the proportion of adults using alternative medicines has not changed since the first study? Assume the random samples are independent. Complete parts (a) through (e).
a. Identify the claim and state H0 and Ha.
Let p1 and p2 be the two population proportions. State H0 and Ha.
b. Find the critical value(s) and identify the rejection region(s)
c. Find the standardized test statistic.
d. Decide whether to reject or fail to reject the null hypothesis.
e. Interpret the decision in the context of the original claim.
18. In a survey of 9700 twelfth grade males, 1578 said they had smoked in the last 30 days. In a survey of 5900 twelfth grade female, 551 said they had smoked in the last 30 days is greater than the proportion of twelfth grade females who said they had smoked in the last 30 days? Assume the random samples are independent. Complete parts (a) through (e).
a. Identify the claim and state H0 and Ha.
Let p1 and p2 be the two population proportions. State H0 and Ha.
b. Find the critical value(s) and identify the rejection region(s).
c. Find the standardized test statistic.
d. Decide whether to reject or fail to reject the null hypothesis.
e. Interpret the decision in the context of the original claim.
19. A past survey of 1,068,000 students taking a standardized test revealed that 8.8% of the students were planning on studying engineering in college. In a recent survey of 1,476,000 students taking the SAT, 9.2% of the students were planning to study engineering. Construct a 95% confidence interval for the difference between proportions p1-p2 by using the following inequality. Assume the samples are random and independent.
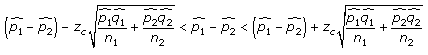
Calculate the confidence interval.
20. Test the claim below about the mean of the difference of two populations. Use a t-test for dependent, random samples at the given level of significance with the given statistics. Is the right-tailed, left-tailed, or two-tailed? Assume the populations are normally distributed.
Claim: μd ≥ 0, α = 0.01. Statistics: d‾ = -2.4, sd = 1.4, n = 19
21. The table below shows the number of hours per day 11 patients suffered from headaches before and after 7 weeks of soft tissue therapy. At α = 0.01, is there enough evidence to conclude that soft tissue therapy helps to reduce the length of time patients suffer from headaches? Complete parts (a) through (f).
|
Patient
|
1
|
2
|
3
|
4
|
5
|
6
|
7
|
8
|
9
|
10
|
11
|
|
Daily headache hours (before)
|
1.8
|
3.3
|
4.2
|
3.2
|
1.9
|
4.4
|
3.6
|
2.8
|
2.2
|
3.7
|
2.8
|
|
Daily headache hours (after)
|
1.4
|
3.7
|
1.5
|
2.4
|
1.3
|
1.2
|
3.3
|
2.7
|
1.4
|
1.3
|
3.3
|
a. Identify the claim and state H0 and Ha.
Let μd be the hypothesized mean of the patients' daily headache hours before therapy minus their daily headache hours after it. State H0 and Ha.
b. Find the critical value(s) and identify the rejection region(s).
c. Calculate d‾.
d. Calculate sd.
e. Decide whether to reject or fail to reject the null hypothesis.
f. Interpret the decision in the context of the original claim.