Reference no: EM132565975
Homework - Linear Regression and Correlation
Question 1: Which of the following is false?
- If the correlation between two variables is close to 0.01, then there is a very weak linear relation between them.
- Correlation coefficient and the slope always have the same sign (positive or negative).
- If the correlation coefficient is 1, then the slope must be 1 as well.
- Correlation measures the strength of linear association between two numerical variables.
Question 2:
The scatterplot below shows the relationship between a sample of 108 college students' GPAs and number of times they visited office hours in the past semester. Based on this scatterplot, which of the following is true?
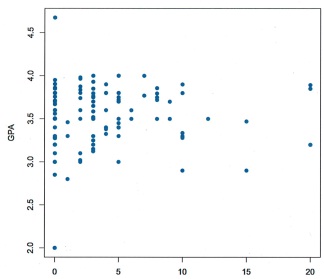
Number of office hours visits last semester
- A linear model is not appropriate for evaluating the relationship between GPA and number of office hours visits in the past semester.
- There is a strong, positive, linear relationship between students' GPAs and number of times they visited office hours in the past semester.
- The scatterplot displays constant variance of GPA across the span of number of office hours visits.
- It is impossible to determine if a linear model would be appropriate for evaluating the relationship between GPA and number of office hours visits in the past semester without seeing a histogram of the residuals.
Question 3:
The scatterplot below shows the relationship between poverty rate in the 51 states in the US (including DC) and percentage of households with a female head (no husband present). The average poverty rate is 11.35% with a standard deviation of 3.1% and the average percentage of households with a female head is 11.63% with a standard deviation of 2.36%. The correlation between these variables is 0.53. Which of the below is the correct linear model for predicting poverty rate from percentage of households with a female head.
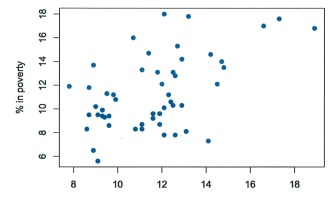
% Female Householder, no husband present
- poverty = 19.49 + 0.4 * female_household
- poverty = 6.7 - 0.4 * female_household
- poverty = 3.7 - 0.7 * female_household
- poverty = 3.2 + 0.7 * female_household
Question 4:
Based on the data shown below, calculate the regression line (each value to two decimal places)
y = ________ x+ ____________
|
x
|
y
|
|
2
|
14.68
|
|
3
|
18.07
|
|
4
|
18.66
|
|
5
|
19.85
|
|
6
|
19.94
|
|
7
|
18.83
|
|
8
|
20.52
|
|
9
|
21.91
|
|
10
|
21.4
|
|
11
|
22.29
|
|
12
|
21.58
|
|
13
|
23.17
|
|
14
|
25.06
|
Question 5:
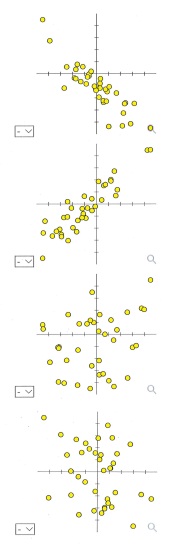
Match each scatterplot shown below with one of the four specified correlations.
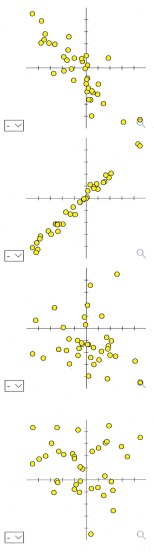
a. 0.99
b. -0.10
c. -0.84
d. -0.15
Question 6:
Based on the data shown below, calculate the correlation coefficient (rounded to three decimal places)
| x |
y |
|
4
|
11.2
|
|
5
|
9.45
|
|
6
|
13.7
|
|
7
|
11.25
|
|
8
|
14.9
|
|
9
|
12.95
|
Question 7:
Here is a scatter plot for a set of bivariate data.
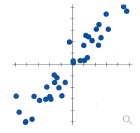
What would you estimate the correlation coefficient to be?
Question 8:
Here is a bivariate data set.
|
x
|
y
|
|
44.7
|
47.9
|
|
42.1
|
39.1
|
|
42.5
|
54.1
|
|
40.6
|
50.7
|
|
48.8
|
56.3
|
|
46.2
|
53.4
|
|
43.1
|
52
|
Find the correlation coefficient and report it accurate to three decimal places.
Question 9:
Here is a bivariate data set.
|
X
|
y
|
|
78.6
|
69.2
|
|
65
|
45.1
|
|
48.2
|
68.9
|
|
64.8
|
46.9
|
|
80.9
|
53.9
|
|
60
|
67.7
|
|
53.9
|
66
|
|
73.2
|
77.2
|
|
28.9
|
41.5
|
|
74.4
|
52.7
|
|
74.7
|
66.8
|
|
52.3
|
44.8
|
|
76.1
|
15.9
|
|
34.3
|
24.5
|
|
49
|
60.2
|
|
51.1
|
19.2
|
|
70.9
|
69.4
|
|
64,1
|
80.7
|
|
49.2
|
21.9
|
Find the correlation coefficient and report it accurate to three decimal places. r =
What proportion of the variation my can be explained by the variation in the values of x? Report answer as a percentage accurate to one decimal place. r2=
Question 10:
You wish to determine if there is a positive linear correlation between the two variables at a significance level of α = 0.001 . You have the following bivariate data set.
|
x
|
y
|
|
27.4
|
173.3
|
|
70
|
137.8
|
|
17.6
|
46.9
|
|
31.4
|
256.8
|
|
10
|
101.8
|
|
30.6
|
123.4
|
|
28.2
|
129.7
|
|
20.4
|
72
|
|
19.3
|
43.3
|
|
16.1
|
-1.8
|
|
33.4
|
-38,4
|
|
30.4
|
180.4
|
|
16
|
17.3
|
|
8.7
|
136.6
|
|
-13.6
|
-58.7
|
|
20.6
|
160.4
|
|
10.7
|
137.1
|
|
7.6
|
-7.5
|
|
18.8
|
17.2
|
|
32.7
|
2.1
|
|
21.5
|
143.3
|
|
27.5
|
205
|
|
26.3
|
7.7
|
|
11.9
|
180.4
|
What is the correlation coefficient for this data set?
To find the p-value for a correlation coefficient, you need to convert to a t-score:
t = √(r2(n-2))/1-r2
This t-score is from a t-distribution with n-2 degrees of freedom.
What is the p-value for this correlation coefficient? p-value =
Your final conclusion is that...
- There is insufficient sample evidence to support the claim the there is a positive correlation between the two variables.
- There is sufficient sample evidence to support the claim that there is a statistically significant positive correlation between the two variables.
Note: In your calculations, round both r and t to 3 decimal places in ALL calculations.
Question 11:
You run a regression analysis on a bivariate set of data (n = 113 ). You obtain the regression equation
y = 0.961x + 40.183
with a correlation coefficient of r = 0.475 (which is significant at a = 0.01 ). You want to predict what value (on average) for the explanatory variable will give you a value of 30 on the response variable.
What is the predicted explanatory value? x=
(Report answer accurate to one decimal place.)
Question 12:
Run a regression analysis on the following
|
x
|
y
|
|
54.6
|
5
|
|
73.2
|
44.1
|
|
77.4
|
65,7
|
|
74.4
|
77.5
|
|
69.9
|
34.9
|
|
71.1
|
57.3
|
|
60.1
|
26.5
|
|
61.2
|
40.3
|
|
75.3
|
55.6
|
|
75.6
|
73.9
|
|
71.9
|
58
|
|
57.3
|
10.6
|
|
58.7
|
23.5
|
|
74.4
|
48.3
|
|
87.2
|
90.2
|
Verify that the correlation is significant at an a = 0.05 . If the correlation is indeed significant, predict what value (on average) for the explanatory variable will give you a value of 41.3 on the response variable.
What is the predicted explanatory value? x
(Report answer accurate to one decimal place.)
Question 13
The following data includes the year, make, model, mileage (in thousands of miles) and asking price (in US dollars) for each of 13 used Honda Odyssey minivans. The data was collected from the Web site of the Seattle P-I on April 25, 2005.
|
year
|
make
|
model
|
|
mileage
|
price
|
|
2004
|
Honda
|
Odyssey
|
EXL
|
20
|
26900
|
|
2004
|
Honda
|
Odyssey
|
EX
|
21
|
23000
|
|
2002
|
Honda
|
Odyssey
|
|
33
|
17500
|
|
2002
|
Honda
|
Odyssey
|
|
41
|
18999
|
|
2001
|
Honda
|
Odyssey
|
EX
|
43
|
17200
|
|
2001
|
Honda
|
Odyssey
|
EX
|
67
|
18995
|
|
2000
|
Honda
|
Odyssey
|
LX
|
46
|
13900
|
|
2000
|
Honda
|
Odyssey
|
EX
|
72
|
15250
|
|
2000
|
Honda
|
Odyssey
|
EX
|
82
|
13200
|
|
2000
|
Honda
|
Odyssey
|
|
99
|
11000
|
|
1999
|
Honda
|
Odyssey
|
|
71
|
13900
|
|
1998
|
Honda
|
Odyssey
|
|
85
|
8350
|
|
1995
|
Honda
|
Odyssey
|
EX
|
100
|
5800
|
Compute the correlation between mileage and price for these minivans. (Assume the correlation conditions have been satisfied and round your answer to the nearest 0.001.)
Question 14
The line of best fit through a set of data is
y= 31.776 + 0.251x
According to this equation, what is the predicted value of the dependent variable when the independent variable has value 70?
y =
Question 15
Match each scatterplot shown below with one of the four specified correlations.
a. -0.87
b. -0.29
c. 0.26
d. 0.91