Reference no: EM132314827
Foundation in Mathematics and Statistics Assignment -
Note: All questions are compulsory. Answer in your own words.
Q1. State whether the following statements are True or False. Give reason in support of your answer:
(a) The nth term of the sequence ¼. -½, 1, -2, . . . is ¼(-2)n.
(b) Symmetric difference of two sets A = {1, 2, 3} and B = {2, 3, 7, 9} is {1, 3, 7}.
(c) limx→5|x-5|/(x-5) = 1
(d) Ratio scale is highest level of measurement scale because here measurements of the characteristic under study can be positive or negative or both.
(e) The range of the data shown in the following frequency distribution is 350:
|
Classes
|
0-50
|
50-100
|
100-150
|
150-200
|
200-250
|
250-300
|
300-350
|
|
Frequencies
|
10
|
20
|
30
|
40
|
30
|
20
|
0
|
Q2 (a) In a city having total population of 1,00,000, out of which 10,000 can read and speak English, 88000 can read and speak Hindi and 80000 can read and speak Hindi only. Find how many of them can read and speak:
(i) Both the languages.
(ii) English only.
(iii) Neither Hindi nor English.
(b) Show that the set {1, -2, 4, -8, 16, -32, . . . } is enumerable.
(c) How many 5 digits numbers are possible using 8 digits 2 to 9 such that three digits 2, 5 and 9 are always included?
Q3. (a) Expand (8 - 3x)1/3 by binomial theorem.
(b) Expand (2 - ax)5 by binomial theorem for any index.
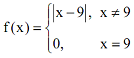
Q4. Discuss the continuity and differentiability of the following function at x = 9.
Q5. Evaluate the following integrals:
i) ∫3x/((x+2)(x-1)2) dx
ii) 2∫ 9 f(x)/(f(x)+f(11-x)) dx
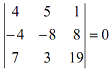
Q6. (a) Without expanding prove that
(b) Draw box plot for batting scores of the player given below:
|
Player
|
10, 62, 22, 8, 90, 13, 105, 155, 25, 53, 6, 4, 52, 57, 27
|
Q7. (a) Find a matrix B such that B 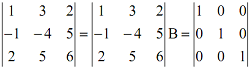
(b) A researcher visits 100 families and collects the information. He/she has ten questions in his/her questionnaire listed below from i to x. Assume that he/she gets information from all 100 families for all the 10 questions. He/she arranges this information in a data frame having 100 rows (each corresponding to response of a family) and 10 columns (each corresponding to a question in his questionnaire). To analyse this data first he/she has to find out scale (nominal, ordinal, interval or ratio) of each column. If he/she is your friend then write scale of each of 10 variables in his/her data frame.
i) Number of members in the family.
ii) Age of the oldest person of the family.
iii) Sex of the oldest person of the family.
iv) Highest education qualification among the family members of the family.
v) Monthly income of the family.
vi) Saving (Income in that particular month - expenditure in the same month) of the family. Keep in mind that expenditure may be more that income in that particular month of some family(ies).
vii) Number of mobile phones in the family.
viii) Height of tallest person of the family.
ix) Does the family have landline telephone?
x) Monthly mobile bill of the family.
Q8. The following table shows the life (in weeks) of a sample of 15-watt LED bulbs produced by a manufacturer:
|
Life Time of LED
|
|
50
|
33
|
47
|
73
|
15
|
|
11
|
98
|
24
|
72
|
37
|
|
19
|
82
|
07
|
53
|
51
|
|
36
|
61
|
02
|
25
|
34
|
|
21
|
42
|
45
|
08
|
15
|
|
32
|
23
|
26
|
06
|
17
|
|
15
|
44
|
53
|
55
|
41
|
|
71
|
77
|
74
|
28
|
13
|
|
18
|
13
|
55
|
81
|
06
|
|
05
|
35
|
85
|
17
|
53
|
|
52
|
03
|
60
|
64
|
42
|
|
14
|
58
|
04
|
21
|
32
|
|
91
|
21
|
21
|
09
|
17
|
|
35
|
11
|
72
|
12
|
18
|
|
32
|
20
|
14
|
76
|
11
|
|
13
|
15
|
34
|
23
|
32
|
i) Form a frequency distribution by taking suitable width.
ii) Form cumulative frequency curves (ogives) on one graph.
iii) Find the average (median) of the life of LED bulbs with the help of ogives.