Find the approximate fourier transform for the waveform

Assignment Help Simulation in MATLAB
Reference no: EM131488903

Lab- Matlab - Fourier

Question 1

Find the Fourier transforms for the following waveforms. Plot the waveforms and their magnitude spectra. [Hint: Use Eq. (2-184)
(a) Π(t-3)/4.

(b) 2.

(c) ∧(t - 5)/5

Question 2

By using Eq, (2-184), find the approximate Fourier transform for the following waveform:

          sin(2Πt/512) + sin(70Πt/512), 5 < t < 75     

x(t) =
           0,                     t elsewhere

Question 3

Using a computer program, calculate the DFT of a rectangular pulse, Π(t). Take five samples of the pulse and pad it with 59 zeros so that a 64-point FFT algorithm can be used. Sketch the re-sulting magnitude speculum Compare this result with the actual spectrum for the pulse. Try other combinations of the number of pulse samples and zero-pads to see how the resulting FFT changes.

Lab - Matlab - SNR

Question 1

For a 4-bit PCM system, calculate and sketch a plot of the output SNR (in decibels) as a function of the relative input level, 20 log (xrms/V) for
(a) A PCM system that uses μ = 10 law companding.
(b) A PCM system that uses uniform quantization (no companding).
(c) Which of these. systems is better to use in practice? Why?

Question 2
The performance of a μ = 255 law companded PCM system is to be examined when the input consists of a sine. wave having a peak value of V volts. Assume that M = 256.
(a) Find an expression that describes the output SNR for this companded PCM system.
(b) Plot (S/N)out (in decibels) as a function of the relative input level, 20 log (xrms,/V), Compare this result with that shown in Fig. 3-10.

Lab - Matlab - PSD

Question 1

Evaluate the ND for the waveform shown in Fig. P2-2.
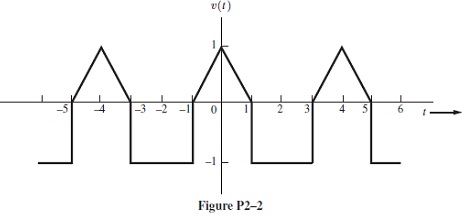
750_Figure.jpg

Question 2
In Fig. 3-16, the PSDs for several line codes are shown. These PSDs were derived assuming unity power for each signal so that the PSDs could be compared on an equal transmission power basis. Rederive the PSDs for these line codes, assuming that the peak level is unity (i.e., A = 1). Plot the PSDs so that the spectra can be compared on an equal peak-signal-level basis.

133_Figure1.jpg

Lab- Matlab - DC and RMS

Question 1

Use v(t) = ae-at, a > 0, to approximate δ(t) as a → ∞
(a) Plot v(t) for a = 0_1, 1, and 10,
(hi Plot 1/(1) for a = 1, and 10,

Lab - Matlab- Bandpass signaling

Question 1

Let the transfer function of an ideal bandpass filter be given by

2121_Figure4.jpg

where BT is the absolute bandwidth of the filter.

(a) Sketch the magnitude transfer function |H(f)|
(b ) Find an expression for the waveform at the output, v2(t), if the input consists of the pulsed carrier

v1(t) = AΠ(t/T) cos(ωct)

(c) Sketch the output waveform v2(t) for the case when BT= 4/T and fc >> BT.

(Hint: Use the complex-envelope technique, and express the answer as a function of the sine integral, defined by

 Si(u) = 0usinλ/λ.dλ

The sketch can be obtained by looking up values for the sine integral from published tables [Abramowitz and Stegun, 1964] or by numerically evaluating Si (u).

Question 2:

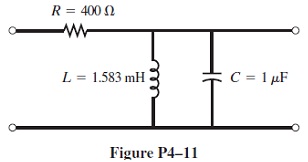
A bandpass filter as shown in fig P4-11 has the transfer function

H(s) = Ks/(s2 + (ω0/Q)s + ω02)

where Q = R√(C/L) the resonant frequency is fo = 1/(2Π√LC), ω0 = 2Πf0, K is a constant, and values for R, L, and C are given in the figure. Assume that a bandpass signal with fc = 4 kHz and a bandwidth of 200 Hz passes through the filter, where f0 =fc.
899_Figure2.jpg

(a) Using Eq. (4-39), find the bandwidth of the filter.
(b) Plot the carrier delay as a function of f about fo.
(c) Plot the group delay as a function of f about fo.
(d) Explain why the filter does or does not distort the signal.

Lab - Matlab- Modulated signals and filters

Question 1

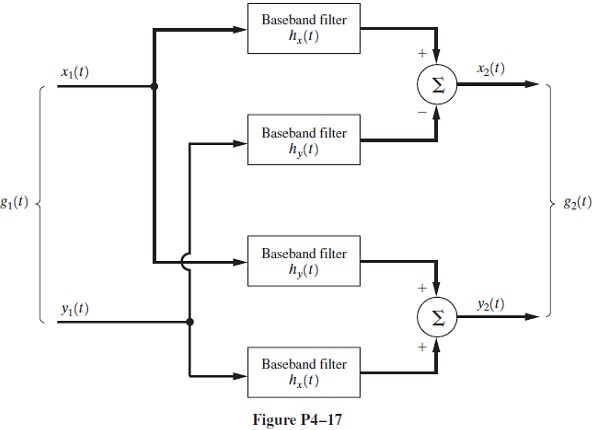
Plot the amplitude response, the phase response, and the phase delay as a function of frequency for the following low-pass filters, where B= 100 Hz:
1465_Figure3.jpg

(a) Butterworth filter, second order:

H(f) = 1/(1+√2(if/B) + (jf/B))2

(b) Butterworth filter, fourth order:

H(f) = 1/[(1+ 0.765(jf/B) + (jf/B)2][1 + 1.848(jf/B) + (jf/B)2]

Compare your results for the two filters.

Question 2

The nonlinear output-input characteristic of an amplifier is

vout(t) = 5vin(t) + 1.5v2in(t) + 1.5v3in(t)

Assume that the input signal consists of seven components:

Vin(t) = 1/2 + 4/Π26k=1 1/(2k -1)2.cos[(2k - 1)Πt]

(a) Plot the output signal and compare it with the linear output component 5vin(t).

(b) Take the FFT of the output vout(t), and compare it with the spectrum for the linear output component.

Verified Expert

This assignment is laboratory work in MATLAB. The work comprises of 6 Lab work from lab 2 to lab 7 lab 2 is about fourier transform of the waveforms and this is done for all 2 questions lab 3 is about PCM which calculates based on companding and SNR is output lab 4 is about calculation of the PSD of the signal. This is divided in 2 question lab 5 is about DC and RMS value of the signal. This is also about Fourier Transform lab 6 is about MATLAB bandpass filtering. This calculates based on MATLAB lab 7 is about Modulated signal and filters, butterworth filter is used

Reference no: EM131488903

Questions Cloud

How many euros did newspaper likely state could be converted : (Cross rates) This morning, you noticed the following information in your financial newspaper.
Role of law impact business and commerce : How does the role of law impact business and commerce? and with that being said Why are laws necessary to govern business in an environment of "free trade"?
Provide a rationale for the progressive insurance group : Provide a rationale for the Progressive Insurance group, indicating the significant factors driving your decision as a financial manager.
Corporate officers and tamik board : In this scenario, it is not clear that the other corporate officers and Tamik's board of directors were aware of the actions of its CEO, Arnett.
Find the approximate fourier transform for the waveform : find the approximate Fourier transform for the waveform: Plot the waveforms and their magnitude spectra
What is australian dollar gain or loss in inventory value : (Spot exchange rate) Suppose a year ago, Miller Company from Australia had inventory in Switzerland, valued at 1.5 million Swiss francs.
Explain transformational improvement : What transformational model(s) can be used to assist with transformational improvement in relation to organizational performance?-
Evaluate the effectiveness of sec regulation and requirement : Evaluate the effectiveness of SEC regulation and requirements, indicating improvement needed to detect fraud in future. Provide support for your recommendation.
What is the cross rate of japanese yen to british pounds : (Spot exchange rates) If one euro is priced at bid 9.15 /ask 9.22 Swedish crowns, how many euros can you purchase for 50 Swedish crowns?

Reviews

Write a Review

Simulation in MATLAB Questions & Answers

  Calculate the stress intensity factor

Use the three-parameter zone finite element method or the boundary collocation method to calculate the stress intensity factor K, at the crack tip for the plate

  Build a simulation using newtons laws of motion

Build a new and different simulation of your own using Newtons laws of motion and Show the code and describe how it works

  Write the specification of load mover

Write the specification of LOAD MOVER detailed of the whole design and precise for automatic control section and divide the design into various modules and Is the kernel required if yes which one?

  Design the automatic control section using statecharts

Aim of this project is to design an embedded system which can move loads from one place to another. The system can be operated manually, automatically and wirelessly.

  Need an expert who can model a drill in simulink

Need an expert who can model a drill in Simulink. Working model of a drill needing for an improvment to behave more realistically as a drill to drill through plastic block.

  Project is on load frequency control using fpid

Project is on load frequency control using FPID tuned using GA and PSO algorithm and the system is a two area system.

  Number of packets received with time

Let x be the number of packets received with time -

  Build a matlab based graphical user interface

Build a Matlab based graphical user interface (GUI) that operates in conjunction with a base Matlab/ Simulink simulation program. Any base simulation is considered acceptable.

  Build a matlab based graphical user interface

Build a Matlab based graphical user interface (GUI) that operates in conjunction with a base Matlab/ Simulink simulation program. Any base simulation is considered acceptable.

  Simulate the standardised sum of independent

Simulate the standardised sum of independent and identically distributed variates - Fit a linear regression model as in Q5, and plot your estimates for β0 and β1 as N increases, together with a line indicating their true values. Supply your code.

  Plot the original periodic square wave

Plot the original periodic square wave on the same graph. Comment on the difference between the original periodic square wave and its truncated Fourier series presentation.

  Use matlab to plot the function

Plot the original periodic square wave on the same graph. Comment on the difference between the original periodic square wave and its truncated Fourier series presentation.

Free Assignment Quote

Assured A++ Grade

Get guaranteed satisfaction & time on delivery in every assignment order you paid with us! We ensure premium quality solution document along with free turntin report!

All rights reserved! Copyrights ©2019-2020 ExpertsMind IT Educational Pvt Ltd