Reference no: EM131416942
Refer to given Exercise, in which the proportions of obese children in urban and rural areas are to be compared. Random samples of 900 children from each type of area are taken. Suppose that in fact, 20% of the children are obese in both populations.
a. Give numerical values for the mean and standard deviation of the sampling distribution of P^1 - P^2.
b. Suppose that the samples are taken and the difference in sample proportions is 0.05. Find the standardized statistic corresponding to this difference.
c. Draw a picture of the sampling distribution, and illustrate where the difference of 0.05 falls on it.
d. If the population proportions really are equal, is a difference in sample proportions of 0.05 plausible? Explain.
Exercise
Researchers would like to know whether the proportions of elementary school children who are obese differ in rural and urban areas. They plan to take random samples of 900 children from urban areas and 900 children from rural areas and compare the proportions that are obese. Define Population 1 to be elementary school children in urban areas and Population 2 to be elementary school children in rural areas.
a. Define in words what the parameter p1 represents in this situation.
b. Define in words what P^1 is in this situation.
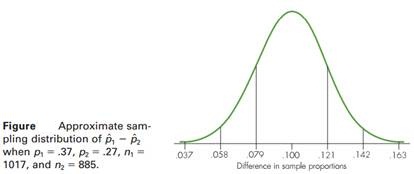
c. Suppose that, unknown to the researchers, p1 and p2 are both .20 (20%). Describe the sampling distribution of P^1 - P^2, including its mean, standard deviation, and shape.
d. Draw a picture of the sampling distribution that you described in part (c), similar to given Figure.
|
Minimum of a continuous function on a closed interval
: Explain the procedure for finding the absolute maximum and minimum of a continuous function on a closed interval. Post a function and find absolute extrema if they exist, as well as the values ofxwhere they occur for the specified domain.
|
|
Draw a picture of the appropriate sampling distribution
: Draw a picture of the appropriate sampling distribution, and show where the value x‾1 - x‾2 = 2 falls on it.- Find the value of the standardized statistic corresponding to x‾1 - x‾2 = 2.
|
|
What role does labor play in role of prices in menomonie
: What role does labor play in the role of prices and value in Menomonie? What sorts of jobs and salaries are available in town and why are some jobs readily available and others snapped up quickly?
|
|
Discuss the components of a social media campaign
: From the scenario, prioritize the most significant components of a social media campaign according to the level of influence each could have on the new product launch. Examine both the social media tools that will provide the highest return on inv..
|
|
Find standardized statistic corresponding to difference
: Suppose that the samples are taken and the difference in sample proportions is 0.05. Find the standardized statistic corresponding to this difference.
|
|
Draw the direction field
: (a) Draw the direction field (b) Without solving the equation determine lim t→∞y(t), when y(t) is a solution to the above ODE with
|
|
With the implementation of business analytics
: With the implementation of business analytics, an organization will also need to implement a good information systems plan in order to collect, manage, and organize all of the data. Why would an organization want to create an implementation plan for ..
|
|
What advice would you give to nestle
: What could Nestlé have done to have avoided the accusations of "killing Third World babies" and still market its product? What advice would you give to Nestlé now in light of the new problem of HIV infection being spread via mothers' milk
|
|
Different internet marketing research tools
: Select four different Internet Marketing research tools Compare and contrast your selected research tools Which tool is the most applicable to your Internet idea that you developed in Week 2? Which tool is the least applicable? Discuss any ethical co..
|