Reference no: EM131129810
Project: Advanced Algebra
Part A - Linear Programming
Do the Linear Programming Activity on page 145 of your textbook.
Use your graphing calculator to work through the 6 steps in the activity to find the maximum or minimum value for our objective function, P. Complete the exercises.
Part B - Building a Business
Do the Building a Business Activity Lab on pages 234-235 of your textbook.
a. Write the inequalities to describe each objective and constraint.
Flavor A's production in a day = 126kg
Flavor B's production in a day = 136 kg
1 cocoa bar requires 1.8g Flavor A and 4.0g Flavor B.
1 choco lot requires 2.8g Flavor A and 1.7g Flavor B.
Lets say we will produce x quantity cocoa bar and y quantity of choco bar.
So, 1.8x +2.8y <= 126000 and 4x+1.7y<=136000
And Acc, to mentioned conditions, machine can wrap 50,000 chocolates per day.
So, x+y<=50,000.
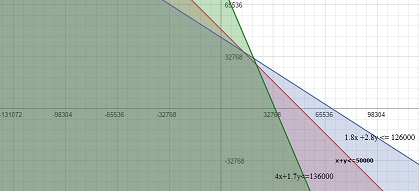
Ans: 1.8x +2.8y <= 126000
4x+1.7y<=136000
x+y<=50,000
b. Graph the inequalities you wrote in part a.

c. Find the quantity of each chocolate bar you should manufacture to maximize your daily profit.
Calculate the profit you will earn.
To earn maximum profit, maximum resources should be utilized.
1.8x +2.8y <= 126000
4x+1.7y<=136000
x+y<=50,000
To utilize maximum, these equations will become
1.8x +2.8y = 126000
4x+1.7y =136000
x+y<=50,000
Solving, 1st and 2nd equation gives x = 20466, y = 31842................1
Solving 2nd and 3rd gives x = 22173, y= 27826..............................2
Solving 1st and 3rd gives, x=14000, y= 36000................................3
1st ans is not possible, because x+y is becoming greater than 50,000. And machine can pack only 50,000 bars. So possible ans are 2nd and 3rd
Profit = 14x+12y
Putting 2nd in profit equation
Profit = 14*22173 + 12*27826 = 644334
Putting 3rd in profit equation
Profit = 14*14000 + 12* 36000 = 628000
So, profit is maximized when cocoa bar is 22173 and choco-bar is 27826. Profit earned is 644334 cents.
Part C - Modeling Using Residuals
Do the Modeling Using Residuals Activity Lab on page 244 of your textbook.
You have learned that there is more than one model for a set of data. You can look at the y-values on the calculator to determine which model is better. When you find these differences, you are looking at the residuals. Residuals that are closer to zero will represent the better model!
Work through the 5 steps in the activity with your graphing calculator. You should see that for this particular problem, the quadratic model is the best.
Part D - Quadratic Inequalities
Do the Quadratic Inequalities Activity Lab on page 296 of your textbook.
Use your graphing calculator to work through activities 1, 2, and 3. Do only problems 1 - 15.
Part E - Pascal's Triangle
Do the Pascal's Triangle Activity Lab on page 352 of your textbook.

Skip question 7. Answer questions 1-6 and question 8 (NOT question 7).
Detailed instructions for submitting projects for grading can be found under the Project Submission link on the online course management system homepage and on your Enrollment Information Sheet.
Attachment:- Activity_Lab.pdf